A confidence interval answers "what is , roughly?". A significance test answers a different question: "is there evidence against one particular claimed value of ?". This topic is the setup, the part you do before any data are analyzed: the hypotheses, the significance level, the procedure and the conditions. Most points lost on test questions are lost here, so we go slowly.
Two competing claims
Every test weighs two hypotheses about a parameter.
- The null hypothesis is the "nothing new" claim: the proportion equals a specific value, the null value . It always has the equals sign.
- The alternative hypothesis is what the study hopes to find evidence for: the proportion is less than, greater than, or different from .
Write them with the parameter, then define the parameter in context right away:
, where is the true proportion of all the city's households that recycle this year.
Hypotheses are always about , the population, never about . We know exactly once we have data, so there is nothing to test about it.
One-sided or two-sided
The direction of comes from the research question, in its own words, before the data are seen.
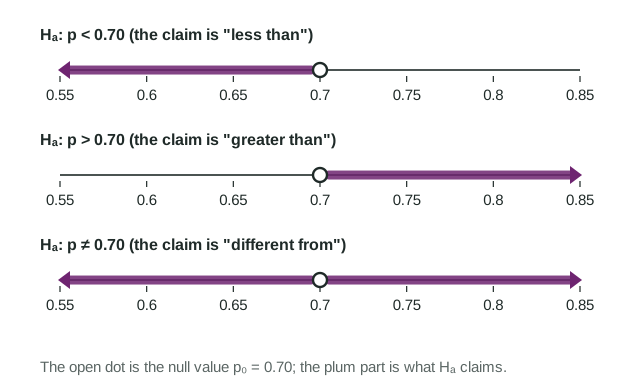
| The question says | Alternative | Kind |
|---|---|---|
| "has dropped", "is lower", "fewer than" | one-sided | |
| "has increased", "more than", "exceeds" | one-sided | |
| "has changed", "is different", "is off", no direction | two-sided |
Never choose the direction after looking at the sample. If a designer asks "is the spinner fair?" and then sees 31% red, the alternative is still . Picking because the data went that way makes ordinary chance results look more convincing than they are, and readers mark it wrong.
The significance level
Before collecting data, choose the significance level (alpha), usually 0.05, sometimes 0.01 or 0.10. It is your standard of evidence: how unlikely the sample result must be, if were true, before you stop believing . A smaller is a stricter standard. In the next two topics you will compare a probability from the data with , so it has to be fixed first.
The procedure and its conditions
For one random sample and a claim about one population proportion, the procedure is the one-sample z test for a proportion (also called a one-proportion z test). Name it in full. The conditions are the ones you know, with one change:
- Random: a random sample (or random assignment).
- 10%: is at most 10% of the population when sampling without replacement.
- Large counts, using : and .
Why and not ? A test reasons inside the world where is true, and in that world . So the expected numbers of successes and failures come from . (For a confidence interval there is no claimed value, so you used the sample's counts instead.)
Worked example. Last year 70% of a city's households recycled. After the city stopped collecting glass at the curb, an environmental group suspects the proportion has dropped. It will survey a random sample of 250 of the city's 82,000 households and use . Set up the test.
Hypotheses. , , where is the true proportion of all the city's households that recycle this year. One-sided, because the group suspects a drop.
Significance level. , chosen in advance.
Procedure. One-sample z test for a proportion.
Conditions. Random: the group will survey a random sample of 250 households. 10%: 250 is less than 10% of the 82,000 households (8,200). Large counts:
All three conditions are met, so the sampling distribution of , assuming is true, is approximately normal with mean 0.70 and standard deviation
A checklist for the setup
- Hypotheses about , with the null value from the claim and the direction from the question.
- defined in context: "the true proportion of all ... who ...".
- stated before the data.
- Procedure named in full.
- Random, 10% and large counts with , each in words with numbers.