An interval for is more than an estimate. It is a list of plausible values for the true difference, and that list can back up a claim or knock one down. This topic is about reading that list carefully and writing the claim in words a reader can trust.
The key value: zero
Most claims about two groups are really about one question: are the two true proportions different? If , then . So the value to look for in the interval is zero difference.
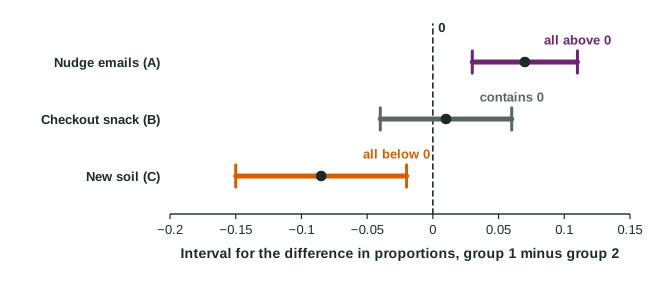
The figure shows the three cases:
| The interval is | Is 0 plausible? | What it supports |
|---|---|---|
| entirely above 0 (Study A: 0.03 to 0.11) | no | convincing evidence that |
| around 0 (Study B: to 0.06) | yes | no convincing evidence of a difference |
| entirely below 0 (Study C: to ) | no | convincing evidence that |
Writing the claim
A claim from an interval has three parts, in this order: the reason (where 0 or the claimed value sits), the evidence wording, and the parameter in context with its direction.
Worked example 1. Study A randomly assigned students in an online course to get weekly nudge emails or no emails. The 95% interval for , the true proportions who finish the course (emails minus no emails), is from 0.03 to 0.11. Does it support the college's claim that nudges help?
Reason: every value in the interval is greater than 0.
Claim: Because every value in the interval from 0.03 to 0.11 is greater than 0, the interval gives convincing evidence that the true proportion of students who finish the course is greater with nudge emails than without them.
Cause? Yes. The students were randomly assigned, so the nudges can be credited with the difference.
Worked example 2. Study B compared random samples of shoppers at two stores. The 95% interval for , the true proportions who buy a snack at checkout, is from to 0.06.
Claim: Because 0 is in the interval from to 0.06, the interval does not give convincing evidence that the true proportions of shoppers who buy a snack at checkout differ between the two stores.
Notice what we did not say. We did not say the proportions are equal. Store 1 could be up to 6 points higher, or up to 4 points lower. The interval simply cannot tell those apart from no difference.
Claims about a size, not just a direction
Sometimes a claim names a number: "younger adults are 15 percentage points more likely to use video visits." Treat that number just like 0. Suppose the 95% interval for is from 0.008 to 0.132. The value 0.15 is above every value in it, so it is not plausible. The interval gives convincing evidence that the difference is real (0 is outside too) but smaller than 15 points. A claim of "at least 5 points" is different: 0.05 is inside, so the interval does not give convincing evidence that the gap is more than 5 points.
Intervals and tests agree
A 95% interval holds, almost exactly, the values of that a two-sided test at would not reject. (The test uses a slightly different standard error, built for the case , so in rare borderline cases the two can disagree.) So an interval that excludes 0 matches a two-sided test that rejects at the 0.05 level, and an interval that contains 0 matches one that fails to reject. A 90% interval matches ; a 99% interval matches . The interval gives you more, though: besides "is there a difference", it says how big the difference plausibly is.
Three traps
- "Proves." No interval proves anything. Use "gives convincing evidence" or "does not give convincing evidence".
- Judging by the center. A positive sample difference is not enough; chance can make one. The whole interval has to be on one side of the value.
- Tiny but convincing. With huge samples an interval like 0.001 to 0.004 excludes 0, so the difference is convincing, yet it is at most 0.4 percentage points. Always say how large the plausible differences are and whether that size matters in context.
Finally, remember the design. An interval entirely above 0 from an observational study shows the populations differ, not why. Only random assignment supports a cause-and-effect claim.