You can now build an interval such as "from 0.618 to 0.702". This topic is about the words that go with it: what the interval says, what "95% confident" means, and how an interval supports or fails to support a claim. These sentences earn or lose points on almost every inference question, so they follow fixed templates.
Interpreting the interval
Three pieces, in this order: the confidence level, the interval, and the parameter in context.
"We are 95% confident that the interval from 0.618 to 0.702 captures the true proportion of all the district's parents who support a later start time."
The parameter is always about the population ("all the district's parents"), never about the sample. You already know the sample proportion exactly; the interval exists because you do not know the population proportion.
Interpreting the confidence level
The confidence level describes the method, not one interval. Imagine repeating the whole study many times:
"If we took many random samples of 500 parents and built a 95% interval from each, about 95% of the intervals would capture the true proportion of all the district's parents who support a later start time."
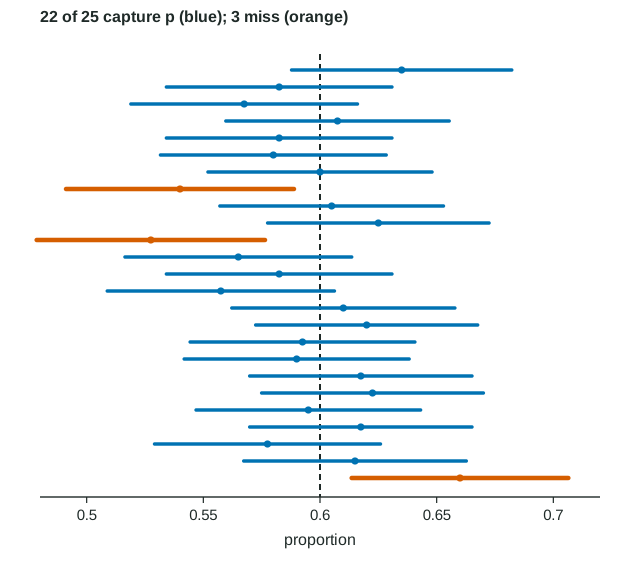
The figure shows the idea. Each sample gives a different , so each interval sits in a different place. The true proportion does not move. Some intervals miss it, and we never know which ones, which is why we say "confident" and not "certain".
Readings that lose the point
| Wrong reading | Why it is wrong |
|---|---|
| "There is a 95% probability that is between 0.618 and 0.702." | is a fixed number, and this interval is fixed too: it either captures or it does not. The 95% belongs to the method. |
| "95% of parents are between 0.618 and 0.702." | Each parent supports the change or not. The interval is about one proportion, not about individuals or about 95% of the data. |
| "We are 95% confident the sample proportion is in the interval." | The sample proportion is the center of the interval, so it is always inside. The target is the population proportion. |
| "95% of samples will have between 0.618 and 0.702." | Other samples give other intervals; the 95% is about intervals capturing . |
Plausible values and claims
Every value inside a confidence interval is a plausible value for the parameter: the data are consistent with it. Values outside the interval are not plausible at that confidence level. That gives a simple rule for judging a claim:
- The claimed value is inside the interval. It is plausible. The interval does not give convincing evidence against the claim. It does not prove the claim either, because many other values are plausible too.
- The interval lies entirely on one side of the claimed value. The claimed value is not plausible, and the interval gives convincing evidence that the parameter is greater than (or less than) it.
Worked example. A school board says more than 60% of the district's parents support a later start. In a random sample of 500 parents, 330 support it, and the 95% interval is
Compare. Every value from 0.618 to 0.702 is greater than 0.60, so 0.60 (and anything below it) is not a plausible value.
Conclude. Because every value in the interval from 0.618 to 0.702 is greater than 0.60, the interval gives convincing evidence that the true proportion of all the district's parents who support a later start time is greater than 0.60.
A second claim. A teacher says the true figure is 70%. 0.70 is inside the interval, so it is plausible: the interval does not give convincing evidence that the true proportion is different from 0.70.
Notice what the sample proportion alone cannot do. is above 0.60, but a sample could land above 0.60 by chance even if the true proportion were 0.60 or a bit less. The interval builds in that chance variation; the bare point estimate does not.
Changing the confidence level
A higher confidence level makes the interval longer, so more values become plausible and it is harder to rule a claimed value out. From the same sample, the 99% interval for the parents runs from 0.605 to 0.715. It still lies above 0.60, so the evidence for the board's claim holds even at 99% confidence. With a claimed value of 0.61, the 95% interval would rule it out but the 99% interval would not. Choose the level before looking at the data, and report the one you chose.
On the exam, a claim question earns full credit when you (1) give the interval, (2) say whether the claimed value is inside it, using the word "plausible" or "every value is greater than", and (3) state the conclusion about the parameter in context.