Data usually arrive as a table. Before you summarize anything, you need to read the table correctly: what each row is, what each column holds, and whether each number describes a whole population or just a sample. This page gives you the words for all three.
Observational units and variables
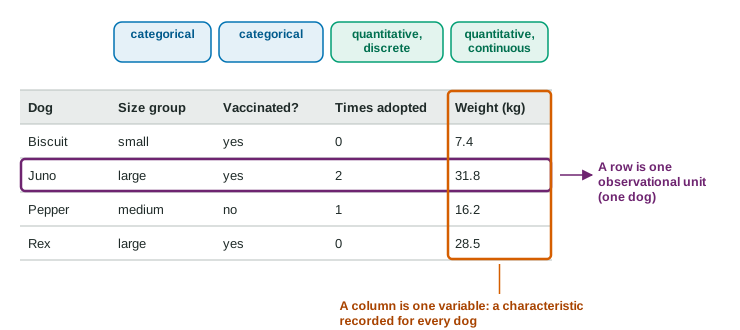
An observational unit is one individual the data describe. It can be a person, an animal, a car, a day, a school. In a data table, each row is one observational unit.
A variable is a characteristic recorded for every observational unit, a characteristic whose value can change from one unit to the next. In a table, each column is one variable. "Eye color" is a variable; "brown" is one of its values.
Categorical or quantitative?
A categorical variable places each unit in a group: size group (small, medium, large), vaccinated (yes, no), favorite sport. A quantitative variable records a number that is an amount: weight, time, a count. The test is simple: does arithmetic with the values make sense? The average weight of five dogs tells you something. The average kennel number does not.
That test catches the classic trap. ZIP codes, jersey numbers, phone area codes and kennel numbers are written as numbers, but they are labels. They are categorical.
Quantitative variables come in two kinds.
| Kind | What its values look like | Examples |
|---|---|---|
| Discrete | Separate values with gaps between them, usually counts | number of siblings, texts sent today, times adopted |
| Continuous | Any value in an interval, usually measurements | weight, height, time to run a mile |
Rounding does not change the kind. Height recorded to the nearest centimeter is still continuous, because a true height can be any value in a range.
Parameter or statistic?
A number that describes a population is a parameter. A number that describes a sample is a statistic. A handy memory aid: population goes with parameter, sample goes with statistic.
Parameters are usually unknown, because finding one requires measuring every individual in the population. So we compute a statistic from a sample and use it to estimate the parameter. A parameter is fixed. A statistic changes from sample to sample, because each sample contains different individuals.
Classify the numbers. District records show that 31% of the 1,250 seniors in a school district have a part-time job. A reporter chooses 80 seniors at random; 26% of them have a part-time job.
31%: it comes from records on all 1,250 seniors, the population, so it is a parameter.
26%: it describes the 80 seniors in the sample, so it is a statistic. Another reporter, with another 80 seniors, would likely get a different percent, perhaps 29% or 33%. The 31% would stay 31%.
The variable in both numbers is "has a part-time job" (yes or no), a categorical variable. The observational units are the seniors.
Distributions
The distribution of a variable tells what values the variable takes and how often it takes each one. For "size group" in a shelter, the distribution might be 12 small, 20 medium and 8 large dogs. For "weight", it tells how the weights are spread over the possible values. Describing distributions is the main job of the rest of Unit 1: first for categorical variables with tables and graphs, then for quantitative variables with graphs and numbers.
A checklist for any data table
- What is one row? Those are the observational units.
- For each column: is it a group (categorical) or an amount (quantitative)? If quantitative, a count (discrete) or a measurement (continuous)?
- For each number reported: does it describe the population (parameter) or a sample (statistic)?
Getting these right decides which graph to draw and which summary to compute, so it is worth thirty seconds on every problem.