Variables
Observational units are the individuals in a data set, and variables are the characteristics recorded for each.
Part 1 · Hook
Why this matters
Part 2 · Before you start
What this builds on
Part 3 · Prerequisite check
Quick check before you start
1. A city asks 500 of its 80,000 adults about a new park. What is the sample?
- The 500 adults who were asked
- The 80,000 adults in the city
- The new park
- The city council
Show the answer
The sample is the part of the population that data come from.
- Correct: The 500 adults who were asked:
- The 80,000 adults in the city:
- The new park:
- The city council:
2. Which question needs data from many individuals?
- How long do adults in the city spend commuting?
- How long is the main bridge?
- What year was the park built?
- How many members are on the city council?
Show the answer
Commute times vary from person to person; the other answers are single facts.
- Correct: How long do adults in the city spend commuting?:
- How long is the main bridge?:
- What year was the park built?:
- How many members are on the city council?:
Part 4 · See it
See it first
Part 5 · Step by step
How it works, step by step
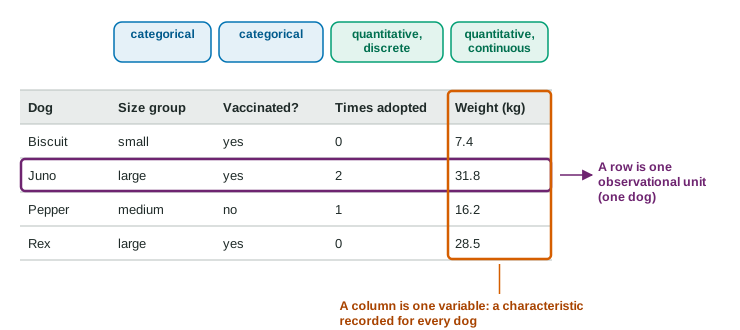
- Each row of a data table is one individualthe individuals are the observational units
- Each column records one characteristic for every individualeach column is a variable, and its values can differ from row to row
- Some variables put individuals into groups, others record amountscategorical and quantitative variables need different summaries and graphs
- A number can describe the whole population or only the sampleit is a parameter (usually unknown) or a statistic (used to estimate the parameter)
Part 6 · Key ideas
Key ideas
- An observational unit is one individual the data describe: a person, a dog, a fish, a day. A variable is a characteristic recorded for each unit.
- A categorical variable places each unit in a group (size group, yes or no). A quantitative variable records an amount, where arithmetic makes sense.
- Quantitative variables are discrete (separate values, usually counts) or continuous (any value in an interval, usually measurements).
- Numbers that are labels, such as ZIP codes or jersey numbers, are categorical.
- A parameter describes a population; a statistic describes a sample. The distribution of a variable tells what values it takes and how often.
Part 7 · Misconception
A common mistake
The wrong idea: Kennel number is quantitative, because its values are numbers.
What actually happens: Kennel numbers are labels. Ask whether arithmetic makes sense: an average kennel number tells you nothing, so the variable is categorical.
Part 8 · Check yourself
Check yourself
Exam-style questions. Anything you miss goes into your review queue.
Table
Records for five shelter dogs
| Dog | Size group | Vaccinated? | Kennel number | Times adopted before | Weight (kg) |
|---|---|---|---|---|---|
| Milo | small | yes | 14 | 0 | 6.8 |
| Nala | large | no | 3 | 1 | 29.4 |
| Otis | medium | yes | 22 | 2 | 15.1 |
| Pip | small | yes | 7 | 0 | 4.9 |
| Rosie | large | yes | 18 | 1 | 33.0 |
1. What are the observational units in this table?
- Kennels
- The dogs
- The size groups small, medium and large
- The columns of the table, one for each characteristic
Show the answer
Each row describes one dog, so the dogs are the observational units.
- Kennels: Kennel number is one of the variables recorded about each dog; the rows are dogs.
- Correct: The dogs: Right: each row is one dog, and every variable is recorded for each dog.
- The size groups small, medium and large: Those are values of one variable, size group.
- The columns of the table, one for each characteristic: Columns are variables. Observational units are what each row describes.
2. Which variable is categorical even though its values are numbers?
- Weight (kg)
- Times adopted before, a count for each dog
- Vaccinated?, recorded as a yes or a no
- Kennel number
Show the answer
Kennel numbers name places; doing arithmetic with them makes no sense, so the variable is categorical.
- Weight (kg): Weight is a measured amount, so it is quantitative.
- Times adopted before, a count for each dog: A count is quantitative: 2 adoptions is twice as many as 1.
- Vaccinated?, recorded as a yes or a no: This is categorical, but its values are words, not numbers.
- Correct: Kennel number: Right: a kennel number is a label. Averaging two kennel numbers gives nothing useful.
3. How should "Times adopted before" be classified?
- Quantitative and discrete
- Quantitative and continuous, like any measurement
- Categorical, because it takes just a few different values
- Categorical
Show the answer
A count is quantitative, and since it takes whole-number values with gaps between them, it is discrete.
- Correct: Quantitative and discrete: Right: it is a count, and counts take separate whole-number values.
- Quantitative and continuous, like any measurement: A count jumps from 0 to 1 to 2; it does not take every value in between.
- Categorical, because it takes just a few different values: Having few values does not make a variable categorical; these values are amounts.
- Categorical: Every variable is recorded for each dog. What matters is whether the values are amounts.
4. Which variable is quantitative and continuous?
- Times adopted before, which takes the values 0, 1 and 2
- Kennel number, which runs from 1 up to about 25
- Weight (kg)
- Size group
Show the answer
A continuous variable is measured and can take any value in an interval. Weight is one.
- Times adopted before, which takes the values 0, 1 and 2: A count is discrete: no dog has been adopted 1.5 times.
- Kennel number, which runs from 1 up to about 25: Kennel numbers are labels, so the variable is categorical.
- Correct: Weight (kg): Right: weight is measured and can take any value in a range, such as 15.1 or 15.13 kg.
- Size group: Size group puts dogs into groups, so it is categorical even though the groups have an order.
Table
Seniors with part-time jobs
District records show that 31% of the 1,250 seniors in a school district have a part-time job. A reporter chooses 80 of the district’s seniors at random and finds that 26% of the 80 have a part-time job. Those with jobs work an average of 14 hours a week (invented data).
5. In this situation, what is the 31%?
- A statistic, because it is written as a percent
- A variable
- A parameter
- An observational unit of the reporter’s study
Show the answer
A parameter is a number that describes a population. The 31% describes all 1,250 seniors.
- A statistic, because it is written as a percent: A statistic describes a sample. The 31% comes from records on every senior.
- A variable: A variable is a characteristic of each senior, such as whether that senior has a job.
- Correct: A parameter: Right: 31% describes the whole population, all 1,250 seniors in the district.
- An observational unit of the reporter’s study: Observational units are the seniors themselves, not a number about them.
6. In this situation, what is the 26%?
- A statistic
- A parameter, because it describes the district’s seniors
- A variable
- The population that the reporter wants to learn about
Show the answer
A statistic is a number that describes a sample. The 26% describes the 80 seniors chosen.
- Correct: A statistic: Right: 26% describes the sample of 80 seniors the reporter asked.
- A parameter, because it describes the district’s seniors: It describes only the 80 seniors in the sample, so it is a statistic.
- A variable: "Has a job" is the variable; 26% is a number that summarizes it for the sample.
- The population that the reporter wants to learn about: The population is the 1,250 seniors; 26% is a number found from the sample.
7. A league’s official roster lists every player. From it, the average height of all players in the league is 191 cm. A fan measures 12 players and finds an average of 189 cm. Which is correct?
- 191 cm is a statistic and 189 cm is a parameter
- Both are statistics, because both are averages of heights
- Both are parameters, because both describe league players
- 191 cm is a parameter and 189 cm is a statistic
Show the answer
A parameter describes a population (the whole league); a statistic describes a sample (the 12 players).
- 191 cm is a statistic and 189 cm is a parameter: This reverses them: the roster covers the whole league, the population.
- Both are statistics, because both are averages of heights: Whether a number is a parameter or a statistic depends on the group it describes, not on how it is computed.
- Both are parameters, because both describe league players: The 189 describes only the 12 measured players, a sample.
- Correct: 191 cm is a parameter and 189 cm is a statistic: Right: 191 describes every player in the league; 189 describes the 12 measured.
Part 9 · Summary
Summary
Part 10 · Up next
What comes next
Part 11 · Connections