Justifying a Claim Based on a Confidence Interval for a Population Proportion
Interpret an interval with its level, its ends and the parameter in context; interpret the level as the long-run capture rate of the method.
Part 1 · Hook
Why this matters
Part 2 · Before you start
What this builds on
Part 3 · Prerequisite check
Quick check before you start
1. A random sample of 500 gives . Which is the 95% confidence interval for ?
Show the answer
Statistic ± (critical value)(standard error), with for 95% and the square root over .
- Correct: :
- :
- :
- :
2. In a 95% confidence interval, what does the critical value 1.96 come from?
- The middle 95% of the standard normal distribution lies between and
- 1.96 is 95% of 2
- The sample proportion is 1.96 standard errors from
- Large counts requires 1.96 successes
Show the answer
A 95% interval keeps the middle 95% of the standard normal area, leaving 2.5% in each tail.
- Correct: The middle 95% of the standard normal distribution lies between and :
- 1.96 is 95% of 2:
- The sample proportion is 1.96 standard errors from :
- Large counts requires 1.96 successes:
Part 4 · See it
See it first
Part 5 · Step by step
How it works, step by step
- Each random sample gives its own each sample gives its own interval, while the true proportion stays fixed
- The method captures in about 95% of sampleswe say we are 95% confident in one interval, because we cannot tell whether it is one of the misses
- A claimed value lies inside the intervalit is a plausible value, so the interval gives no convincing evidence against it (and does not prove it)
- The whole interval lies above (or below) a claimed valuethat value is not plausible, so the interval gives convincing evidence that the parameter is greater (or less) than it
Part 6 · Key ideas
Key ideas
- Interval: "We are 95% confident that the interval from __ to __ captures the true proportion of all __."
- Level: "If we took many random samples of this size and built a 95% interval from each, about 95% of the intervals would capture the true proportion."
- Values inside the interval are plausible. A claim is supported (convincing evidence) only when the whole interval is on the claimed side.
- Never: "95% probability that is in the interval", "95% of the data", or anything about the sample proportion.
- Higher confidence gives a longer interval, so more values stay plausible.
Part 7 · Misconception
A common mistake
The wrong idea: The claimed value 0.70 is inside the interval, so the interval shows the claim is true.
What actually happens: Inside the interval means plausible, not proven: many other values are plausible too. Say the interval does not give convincing evidence against the claim.
Part 8 · Check yourself
Check yourself
Exam-style questions. Anything you miss goes into your review queue.
Graph
Twenty-five intervals from one population
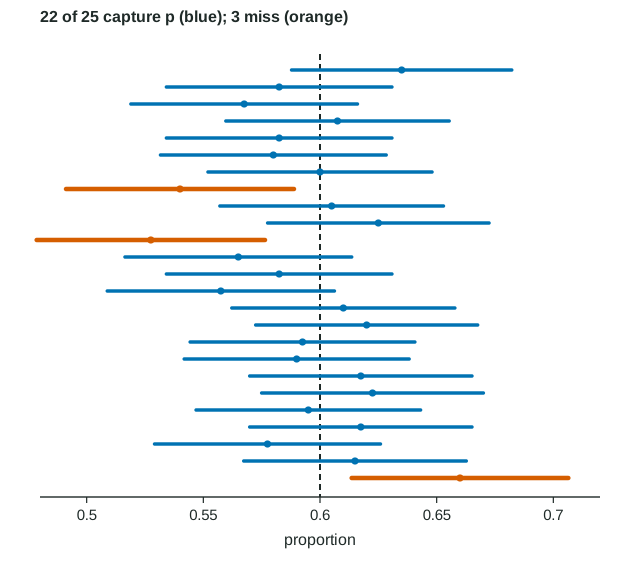
A computer takes 25 random samples of 400 people from a population in which the true proportion with a certain trait is . From each sample it builds a 95% confidence interval for . Each bar is one interval, with a dot at that sample's ; the dashed line is .
1. How many of the 25 intervals capture the true proportion, and is that surprising?
- 22, about what 95% confidence predicts for 25 intervals
- 25, because a 95% interval captures in each sample
- 22, which shows the method gives far less than 95% confidence
- 3, the intervals drawn in a different color
Show the answer
22 intervals cross the dashed line at 0.60 and 3 miss it. In the long run about 95% capture , which is about 23.75 of 25. Getting 22 in one set of 25 is ordinary chance variation.
- Correct: 22, about what 95% confidence predicts for 25 intervals: Right: 22 of 25 is close to 95%, given the chance variation in 25 tries.
- 25, because a 95% interval captures in each sample: About 5% of 95% intervals miss ; here some bars stop short of the dashed line.
- 22, which shows the method gives far less than 95% confidence: The 95% is a long-run rate. 22 out of 25 is well within normal chance variation from 95%.
- 3, the intervals drawn in a different color: The orange intervals are the ones that miss the line. Count the ones that cross it.
2. What does "95% confidence" mean in this picture?
- About 95% of the population has the trait
- Each interval has a 95% chance of containing its own
- In the long run, about 95% of such intervals capture
- About 95% of each sample of 400 falls inside its interval
Show the answer
The confidence level describes the method: if we kept taking random samples and building intervals this way, about 95% of the intervals would capture .
- About 95% of the population has the trait: The population proportion is 0.60. The 95% describes how often the method captures it.
- Each interval has a 95% chance of containing its own : Each interval is centered at its own , so it contains every time.
- Correct: In the long run, about 95% of such intervals capture : Right: the level is a success rate of the method over many samples.
- About 95% of each sample of 400 falls inside its interval: An interval for a proportion is about , not about where individual people fall.
3. Look at the interval in the eighth row, which misses . A student says, "There was a 95% chance that this interval would contain 0.60." Which statement is correct?
- It describes the method; this finished interval does not contain 0.60
- It is correct: this interval still has a 95% chance of containing 0.60
- It is correct, because moves around from sample to sample
- It is wrong: this interval had a 5% chance of being built
Show the answer
Before the sample was taken, the method had a 95% chance of producing an interval that captures . Once this interval is built, it either contains 0.60 or it does not; this one does not.
- Correct: It describes the method; this finished interval does not contain 0.60: Right: probability belongs to the method, not to a finished interval.
- It is correct: this interval still has a 95% chance of containing 0.60: The interval is fixed and so is . It misses 0.60, and no probability changes that.
- It is correct, because moves around from sample to sample: The parameter is fixed at 0.60. The intervals are what change from sample to sample.
- It is wrong: this interval had a 5% chance of being built: The 5% is the long-run share of intervals that miss, not the chance of building one particular interval.
Table
A later school start time
A school board says that more than 60% of the district's parents support starting high school later. A local paper selects a random sample of 500 of the district's 9,000 parents, and 330 of them () support the change. The conditions for inference are met.
| Confidence level | Interval |
|---|---|
| 95% | from 0.618 to 0.702 |
| 99% | from 0.605 to 0.715 |
4. A teacher claims that 70% of the district's parents support the later start. What does the 95% interval say about this claim?
- 0.70 is plausible, so there is not convincing evidence against the claim
- 0.70 is in the interval, so the interval shows that 70% of parents support the change
- 0.70 is far from 0.66, so the interval gives convincing evidence against the claim
- Nothing, because the interval was built for the board's claim of 60%
Show the answer
0.70 is inside the interval from 0.618 to 0.702, so it is a plausible value. The interval does not give convincing evidence that the true proportion is different from 0.70; it does not prove that it equals 0.70 either.
- Correct: 0.70 is plausible, so there is not convincing evidence against the claim: Right: a value inside the interval cannot be ruled out.
- 0.70 is in the interval, so the interval shows that 70% of parents support the change: Many values in the interval are plausible, 0.62 and 0.66 among them. Being plausible is not being proven.
- 0.70 is far from 0.66, so the interval gives convincing evidence against the claim: Distance from is not the test; 0.70 is inside the interval, so it is plausible.
- Nothing, because the interval was built for the board's claim of 60%: An interval gives plausible values for ; any claimed value can be compared with it.
5. Which is the correct interpretation of the 95% interval?
- We are 95% confident that the interval from 0.618 to 0.702 captures the true proportion of all the district's parents who support the change
- There is a 95% probability that the proportion of the district's parents who support the change is between 0.618 and 0.702
- We are 95% confident that the interval from 0.618 to 0.702 captures the proportion of the 500 parents in the sample who support the change
- About 95% of the district's parents support the change at a level between 0.618 and 0.702, as the interval shows
Show the answer
Name the level, the interval and the parameter in context. The interval estimates the proportion for all the district's parents.
- Correct: We are 95% confident that the interval from 0.618 to 0.702 captures the true proportion of all the district's parents who support the change: Right: level, interval and parameter in context.
- There is a 95% probability that the proportion of the district's parents who support the change is between 0.618 and 0.702: The true proportion is fixed; it is in this interval or not. Confidence describes the method, so say "95% confident".
- We are 95% confident that the interval from 0.618 to 0.702 captures the proportion of the 500 parents in the sample who support the change: The sample proportion is known exactly, 0.66. The interval is about the whole district.
- About 95% of the district's parents support the change at a level between 0.618 and 0.702, as the interval shows: Each parent either supports the change or not. The interval is about one proportion, not individual parents.
6. Build the interpretation of the 95% confidence level in this context.
Write the conclusion in context.
Show the answer
The level describes what happens over many samples of the same size: the long-run share of intervals that capture the true proportion.
- A full-credit answer: If we took many random samples of 500 parents and built a 95% interval from each, about 95% of the intervals would capture the true proportion of all the district's parents who support a later start time.
7. A news report says, "In a random sample of likely voters, 52% favor Measure 4, with a margin of error of 3 percentage points (95% confidence)." Which conclusion is justified?
- A majority of likely voters favor Measure 4, because 52% is more than half of them
- There is not convincing evidence of a majority, since 0.50 is in the interval
- The poll shows that exactly 52% of likely voters favor Measure 4
- 95% of likely voters favor Measure 4 by 3 percentage points
Show the answer
The interval is , from 0.49 to 0.55. It includes 0.50 and values below it, so the poll does not give convincing evidence that a majority of all likely voters favor the measure.
- A majority of likely voters favor Measure 4, because 52% is more than half of them: The interval reaches down to 0.49, so a proportion of one half or less is still plausible.
- Correct: There is not convincing evidence of a majority, since 0.50 is in the interval: Right: 0.50 is a plausible value.
- The poll shows that exactly 52% of likely voters favor Measure 4: The 52% describes the sample; the margin of error says the population value may differ.
- 95% of likely voters favor Measure 4 by 3 percentage points: That mixes up the confidence level with the result. The 95% describes the method.
Part 9 · Summary
Summary
Part 10 · Up next
What comes next
Part 11 · Connections