Setting Up a Test for a Population Proportion
Set up a test before looking at the data.
Part 1 · Hook
Why this matters
Part 2 · Before you start
What this builds on
Part 3 · Prerequisite check
Quick check before you start
1. A random sample of 250 households is taken from a city of 82,000 households. Which statement checks the 10% condition?
- 250 is less than 10% of 82,000
- 250 is at least 10
- 250 is more than 10% of 2,500
- 10% of the sample recycles
Show the answer
The 10% condition compares the sample size with the population: 10% of 82,000 is 8,200.
- Correct: 250 is less than 10% of 82,000:
- 250 is at least 10:
- 250 is more than 10% of 2,500:
- 10% of the sample recycles:
2. Which is a parameter?
- The proportion of all the city's households that recycle
- The proportion of the 250 sampled households that recycle
- The number of sampled households that recycle
- The sample size, 250
Show the answer
A parameter describes the whole population; the other three describe the sample.
- Correct: The proportion of all the city's households that recycle:
- The proportion of the 250 sampled households that recycle:
- The number of sampled households that recycle:
- The sample size, 250:
Part 4 · See it
See it first
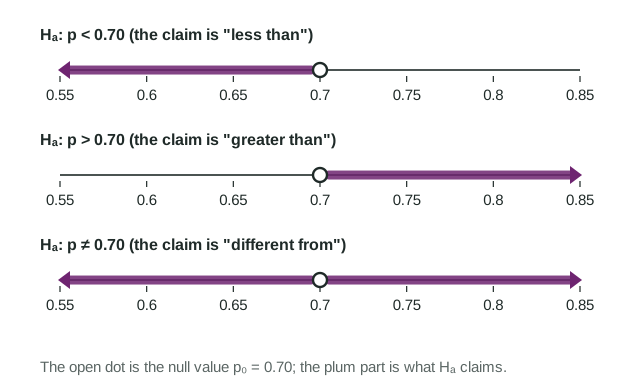
Part 5 · Step by step
How it works, step by step
- A study weighs a claim about a population proportionwrite (no change, the claimed value) and (what the study seeks evidence for)
- The question has a direction ("dropped", "more than")the alternative is one-sided; with no direction ("changed") it is two-sided,
- The standard of evidence must not depend on the datathe significance level is chosen before the data are collected
- The test reasons as if were truelarge counts is checked with : and
Part 6 · Key ideas
Key ideas
- always has the equals sign; is , or .
- Hypotheses are about the parameter , never . Define in context right after them.
- The direction of comes from the question, before the data: never from which way the sample went.
- is the standard of evidence, set in advance. Smaller , stricter standard.
- Procedure: one-sample z test for a proportion. Conditions: random, 10%, large counts with .
Part 7 · Misconception
A common mistake
The wrong idea: The sample came out at 31% red, so the alternative should be .
What actually happens: The alternative comes from the research question, set before the data. If the question was "is the spinner fair?", the alternative is whatever the sample shows.
Part 8 · Check yourself
Check yourself
Exam-style questions. Anything you miss goes into your review queue.
Table
Has recycling dropped?
Last year, 70% of a city's households recycled. This year the city stopped collecting glass at the curb, and an environmental group suspects that the proportion of households that recycle has dropped. The group plans to survey a random sample of 250 of the city's 82,000 households.
| Item | Value |
|---|---|
| Population | the city's 82,000 households, this year |
| Last year's proportion that recycled | 0.70 |
| Planned sample | 250 households, chosen at random |
| Significance level |
1. Which pair of hypotheses matches the group's question?
- ,
- ,
- ,
- ,
Show the answer
The null hypothesis says nothing has changed, . The group suspects a drop, so the alternative is one-sided: . Both are about the parameter .
- Correct: , : Right: no change against the suspected drop.
- , : The group's question has a direction (a drop), so the alternative is one-sided, not two-sided.
- , : These are reversed. The null hypothesis holds the equals sign; the suspected change is the alternative.
- , : Hypotheses are about the parameter , never about the sample statistic .
2. Which is the correct definition of the parameter in these hypotheses?
- The proportion of the 250 sampled households that recycle
- The true proportion of all the city's households that recycle this year
- The number of the city's households that recycle this year
- The proportion of the city's households that recycled last year
Show the answer
The parameter is a population value: the proportion of all the city's households that recycle this year, after the change.
- The proportion of the 250 sampled households that recycle: That is , a statistic. The hypotheses are about the population.
- Correct: The true proportion of all the city's households that recycle this year: Right: a population proportion, in context.
- The number of the city's households that recycle this year: A count is not a proportion, and in these hypotheses is a proportion.
- The proportion of the city's households that recycled last year: Last year's value, 0.70, is the null value . The parameter is this year's proportion.
3. Which correctly checks the large counts condition for this test?
- and , both at least 10
- is at least 30
- 250 is less than 10% of the 82,000 households
- The sample will have at least 10 households of each kind
Show the answer
A test assumes is true while it checks conditions, so it uses : and
- Correct: and , both at least 10: Right: use the null value in a test.
- is at least 30: "At least 30" is a rule of thumb for means. Proportions need expected successes and failures.
- 250 is less than 10% of the 82,000 households: That is the 10% condition, which protects independence, not the normal shape.
- The sample will have at least 10 households of each kind: We have not seen the sample yet; the check uses , which also matches the assumption that is true.
4. Why does the group need to check the 10% condition, and is it met?
- It makes the shape normal; it is met because 250 is at least 10
- It removes bias; it is met because the sample is random
- It makes the households close to independent; met, since 250 is under 8,200
- It is not needed, because the city has more than 10,000 households
Show the answer
The sample is taken without replacement, so the households are close to independent only if the sample is at most 10% of the population. 10% of 82,000 is 8,200, and 250 is far less.
- It makes the shape normal; it is met because 250 is at least 10: Shape comes from large counts. The 10% condition compares the sample with the population size.
- It removes bias; it is met because the sample is random: Random selection removes bias. The 10% condition is about independence.
- Correct: It makes the households close to independent; met, since 250 is under 8,200: Right: 250 is less than 10% of 82,000.
- It is not needed, because the city has more than 10,000 households: It is needed whenever the sample is drawn without replacement; a large city just makes it easy to meet.
Table
Is the spinner fair?
A mobile game shows a spinner with four equal colored sections and says each color comes up one fourth of the time. A designer suspects the code is off but does not know in which direction. She plans to record 400 spins and use .
| Item | Value |
|---|---|
| Advertised proportion of red | 0.25 |
| Planned spins | 400 |
| Significance level |
5. After the 400 spins, 31% land on red. The designer then rewrites the alternative as . What is wrong with this?
- Nothing, because the sample shows the direction
- The alternative should be
- The hypotheses must be set from the question, before seeing the data
- The null hypothesis should be changed to
Show the answer
Hypotheses come from the question asked before the data are collected. Choosing the direction after seeing which way the sample went makes unusual results look more convincing than they are.
- Nothing, because the sample shows the direction: Letting the data pick the direction is the mistake: the question had no direction.
- The alternative should be : Hypotheses are never written about .
- Correct: The hypotheses must be set from the question, before seeing the data: Right: her question was two-sided, so the alternative stays .
- The null hypothesis should be changed to : The null value comes from the claim being weighed, 0.25, not from the sample.
6. A factory's defect rate has been 2%. After a new supplier starts, a manager wants to know whether the defect rate has changed. Which alternative hypothesis fits?
Show the answer
"Has changed" has no direction, so the alternative is two-sided: .
- : That asks only whether the rate went up. "Changed" could mean up or down.
- : That asks only whether the rate went down.
- Correct: : Right: "changed" in either direction is two-sided.
- : The alternative never contains the equals sign; that is the null hypothesis.
7. A student asks: "Is the proportion of all students at my school who own a pet different from the national figure of 0.65?" She surveys a random sample of 120 of the school's 1,800 students. Which plan fits her question?
- A one-sample z test with and
- A one-sample z test with and
- A one-sample z test with and
- A test with against the national survey's sample
Show the answer
A question with a specific claimed value and "different from" calls for a one-sample z test for a proportion with and .
- Correct: A one-sample z test with and : Right: one proportion, a claimed value, no direction.
- A one-sample z test with and : "Different from" has no direction, so the alternative is two-sided.
- A one-sample z test with and : The equals sign and the national figure belong in the null hypothesis.
- A test with against the national survey's sample: Hypotheses are about the school's population proportion , not a sample proportion.
Part 9 · Summary
Summary
Part 10 · Up next
What comes next
Part 11 · Connections