p-Values
A p-value measures how surprising the data are if H_0 is true.
Part 1 · Hook
Why this matters
Part 2 · Before you start
What this builds on
Part 3 · Prerequisite check
Quick check before you start
1. A study tests . Which large counts check is right for ?
- and , both at least 10
- only
- 300 is less than 10% of the population
Show the answer
A test checks large counts with the null value , because it assumes is true.
- Correct: and , both at least 10:
- :
- only:
- 300 is less than 10% of the population:
2. For a normal distribution with mean 0.40 and standard deviation 0.0283, about what is the z-score of 0.35?
Show the answer
- Correct: :
- :
- :
- :
Part 4 · See it
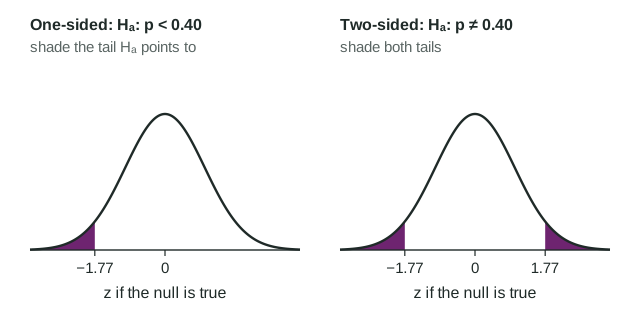
See it first
Part 5 · Step by step
How it works, step by step
- Assume is true, so is approximately normal with mean and standard deviation
- Standardize the observed the test statistic
says how many standard deviations it is from - Find the area beyond in the direction of (both tails if two-sided)that area is the p-value: the chance of a result at least this extreme if is true
- The p-value is smallthe result would be rare under , which is evidence against and for (but never proof)
Part 6 · Key ideas
Key ideas
- Test statistic:
, with in the square root. - p-value: the probability, assuming is true, of a statistic at least as extreme as observed, in the direction of . Two-sided: double one tail.
- Interpret: "Assuming the true proportion of all __ is , there is a __ probability of getting a sample proportion of __ or less (more) by chance in a random sample of __."
- A simulation estimates a p-value: the share of simulated results, made assuming , at least as extreme as the real one.
- Not the probability that is true. A large p-value does not prove .
Part 7 · Misconception
A common mistake
The wrong idea: A p-value of 0.0385 means there is a 3.85% chance that the null hypothesis is true.
What actually happens: The p-value is computed assuming is true. It is the probability of data at least this extreme if holds, not the probability that holds.
Part 8 · Check yourself
Check yourself
Exam-style questions. Anything you miss goes into your review queue.
Table
Pastries with coffee
A coffee chain's head office says that 40% of its customers order a pastry. A store manager suspects the proportion at her store is lower. She selects a random sample of 300 orders from the store's many orders this month, and 105 of them include a pastry. She tests against , where is the true proportion of all the store's orders this month that include a pastry. The conditions are met.
| Orders sampled | With a pastry | Sample proportion |
|---|---|---|
| 300 | 105 |
1. Calculate the standardized test statistic. Give two decimal places.
Type a number. A table answer and a calculator answer are both accepted.
Show the answer
- Answer: -1.77
2. Type the expression for the test statistic with the values substituted, as you would show it on the exam.
Type the expression as on the exam, with the values substituted.
Show the answer
(statistic − null value) / (standard deviation of the statistic): .
- Answer:
3. Find the p-value of the test. Give four decimal places.
Type a number. A table answer and a calculator answer are both accepted.
Show the answer
is , so the p-value is the area to the left of : . Technology (a 1-proportion z test) gives 0.0385. Table A with gives 0.0384.
- Answer: 0.0385
4. Build the interpretation of the p-value, 0.0385, in context.
Write the conclusion in context.
Show the answer
A p-value is a probability computed assuming is true: the chance of a sample result at least as extreme as the one observed, in the direction of .
- A full-credit answer: Assuming the true proportion of all the store's orders that include a pastry is 0.40, there is a 0.0385 probability of getting a sample proportion of 0.35 or less by chance in a random sample of 300 orders.
5. What does the small p-value, 0.0385, suggest?
- This result is unusual if , which is evidence that
- There is a 3.85% chance that the head office's figure of 40% is correct
- About 3.85% of the store's orders include a pastry
- The manager has proven that fewer than 40% of orders include a pastry
Show the answer
If the true proportion were 0.40, a sample proportion as low as 0.35 would happen only about 4% of the time. That makes 0.40 hard to believe, which is evidence for .
- Correct: This result is unusual if , which is evidence that : Right: a small p-value counts against and for .
- There is a 3.85% chance that the head office's figure of 40% is correct: The p-value assumes the figure is correct; it is not the probability that it is.
- About 3.85% of the store's orders include a pastry: The p-value is a probability about samples, not a proportion of orders.
- The manager has proven that fewer than 40% of orders include a pastry: A small p-value is evidence, never proof; a sample this low can still happen when .
6. For the banner test (, ), find the p-value. Give four decimal places.
Type a number. A table answer and a calculator answer are both accepted.
Show the answer
Two-sided: count both tails. , so the p-value is .
- Answer: 0.0736
7. A student writes: "The p-value is 0.02, so there is a 2% chance that the null hypothesis is true." What is the error?
- There is no error
- It should say 98%, the complement, is the chance that is true
- The p-value is computed assuming is true, so it is not the chance is true
- A p-value has to be compared with 0.5 before it means anything
Show the answer
The p-value is computed by assuming is true. It is the probability of data this extreme or more under , not the probability that holds.
- There is no error: This is the most common misreading of a p-value.
- It should say 98%, the complement, is the chance that is true: The complement is not the probability that is true either.
- Correct: The p-value is computed assuming is true, so it is not the chance is true: Right: the condition is "if is true", not "that is true".
- A p-value has to be compared with 0.5 before it means anything: A p-value is compared with , chosen in advance, not with 0.5.
Part 9 · Summary
Summary
Part 10 · Up next
What comes next
Part 11 · Connections