Carrying Out a Test for a Population Proportion
A complete test runs state, plan, do, conclude.
Part 1 · Hook
Why this matters
Part 2 · Before you start
What this builds on
Part 3 · Prerequisite check
Quick check before you start
1. For , , and , which is the test statistic?
Show the answer
Statistic minus null value, over the standard deviation computed with .
- Correct: :
- :
- :
- :
2. Which hypotheses fit "has the proportion gone down from 18%?"
- ,
- ,
- ,
- ,
Show the answer
The equals sign goes in ; "gone down" gives a one-sided alternative about .
- Correct: , :
- , :
- , :
- , :
Part 4 · See it
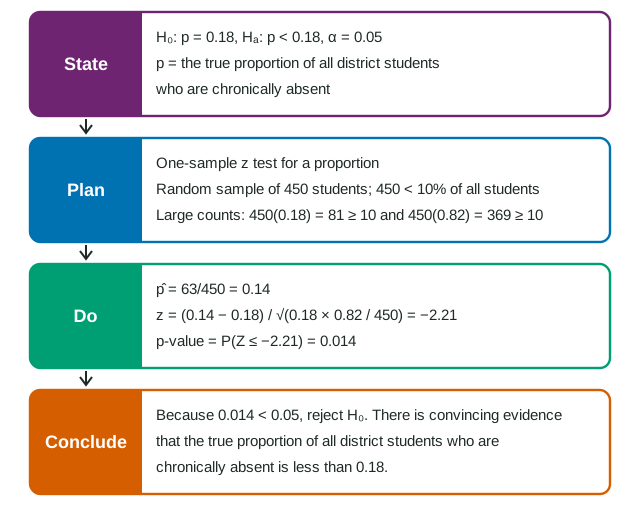
See it first
Part 5 · Step by step
How it works, step by step
- The p-value is less than the result is too unusual under : reject , and there is convincing evidence for
- The p-value is greater than fail to reject : there is not convincing evidence for (which does not make true)
- The data come from a random samplethe conclusion applies to the population that was sampled
- There was no random assignment to treatmentsthe test can show a change but not what caused it
Part 6 · Key ideas
Key ideas
- Four steps: State (, , , defined), Plan (procedure, conditions), Do (, p-value), Conclude.
- Conclusion: "Because the p-value of __ is less than = __, we reject . There is convincing evidence that the true proportion of all __ is __ than __."
- Fail to reject: "there is not convincing evidence that ...", still naming the direction of . Never "accept " or "prove".
- A two-sided test at almost always rejects when is outside the 95% interval, and fails to reject when it is inside.
- Random sampling lets you generalize; only random assignment lets you claim cause.
Part 7 · Misconception
A common mistake
The wrong idea: The p-value of 0.38 is greater than 0.05, so we accept : the proportion has not changed.
What actually happens: Fail to reject : there is not convincing evidence that the proportion has changed. The data are consistent with , but a test cannot show that is true.
Part 8 · Check yourself
Check yourself
Exam-style questions. Anything you miss goes into your review queue.
Table
A mentoring program and chronic absence
Last year, 18% of a large school district's students were chronically absent (missed 10% or more of school days). This year the district started a mentoring program and wants to know whether the proportion has gone down. A researcher selects a random sample of 450 of the district's 21,000 students; 63 of them are chronically absent so far. She tests against at , where is the true proportion of all the district's students who are chronically absent this year.
| Students sampled | Chronically absent | Sample proportion |
|---|---|---|
| 450 | 63 |
1. Calculate the test statistic. Give two decimal places.
Type a number. A table answer and a calculator answer are both accepted.
Show the answer
- Answer: -2.21
2. Find the p-value. Give four decimal places.
Type a number. A table answer and a calculator answer are both accepted.
Show the answer
, so the p-value is the left tail: . Technology (a 1-proportion z test) gives and p-value 0.0136.
- Answer: 0.0136
3. State the conclusion of the test at .
Write the conclusion in context.
Show the answer
Because , reject . The conclusion is about the parameter, in context, with evidence language and the direction of .
- A full-credit answer: Because the p-value of 0.0136 is less than α = 0.05, we reject H0. There is convincing evidence that the true proportion of all the district's students who are chronically absent this year is less than 0.18.
4. Suppose the researcher had chosen before collecting the data. What would she conclude?
- Reject , because the p-value is small
- Fail to reject : not convincing evidence that
- Accept : the true proportion is 0.18
- Change to so the result is significant
Show the answer
Because , she would fail to reject : there would not be convincing evidence at the 1% level that the true proportion is less than 0.18. That does not mean the proportion is 0.18.
- Reject , because the p-value is small: At , the p-value 0.0136 is not small enough: it is greater than 0.01.
- Correct: Fail to reject : not convincing evidence that : Right: .
- Accept : the true proportion is 0.18: A test never accepts ; failing to reject means the evidence is not strong enough.
- Change to so the result is significant: The significance level is fixed before the data; changing it afterward to get a result is not allowed.
Table
Computer output: a four-day school week
A polling firm selects a random sample of 1,000 adults in a state and asks whether they would support a four-day school week. The firm wants to know whether more than half of the state's adults support it. Its software prints the output below.
| Test | X | N | Sample p | Z | P-Value |
|---|---|---|---|---|---|
| p = 0.5 vs p > 0.5 | 532 | 1000 | 0.532 | 2.02 | 0.0215 |
5. The firm had chosen . State the conclusion.
Write the conclusion in context.
Show the answer
Because , fail to reject . The data do not give convincing evidence, at the 1% level, that more than half of the state's adults support a four-day week. This does not show that the true proportion is 0.5.
- A full-credit answer: Because the p-value of 0.0215 is greater than α = 0.01, we fail to reject H0. There is not convincing evidence that the true proportion of all the state's adults who would support a four-day school week is greater than 0.5.
6. A test of against gives a p-value of 0.38. Which conclusion is worded correctly?
- We accept : the true proportion is 0.25
- We fail to reject : not convincing evidence that
- There is a 38% chance that the true proportion is 0.25
- The data prove that the proportion is still 0.25, just as it was before
Show the answer
Because , fail to reject , and say the evidence is not convincing for . Never "accept" or say it is true.
- We accept : the true proportion is 0.25: A test never accepts ; a large p-value means the data are consistent with it, not that it is true.
- Correct: We fail to reject : not convincing evidence that : Right: the decision, then evidence language about .
- There is a 38% chance that the true proportion is 0.25: A p-value is not the probability that is true.
- The data prove that the proportion is still 0.25, just as it was before: Tests never prove; failing to reject only means the evidence was not strong enough.
7. Put the four steps of a significance test in order.
- State: hypotheses, , and the parameter in context
- Plan: name the procedure and check the conditions
- Do: compute the test statistic and the p-value
- Conclude: compare the p-value with and state the conclusion in context
Show the answer
State what you are testing, plan how (procedure and conditions), do the calculation, then conclude in context.
- Correct order: 1. State: hypotheses, , and the parameter in context 2. Plan: name the procedure and check the conditions 3. Do: compute the test statistic and the p-value 4. Conclude: compare the p-value with and state the conclusion in context
Part 9 · Summary
Summary
Part 10 · Up next
What comes next
Part 11 · Connections