Potential Errors When Performing Tests
A Type I error rejects a true H_0 (probability α ); a Type II error fails to reject a false H_0 (probability β , against a specific alternative).
Part 1 · Hook
Why this matters
Part 2 · Before you start
What this builds on
Part 3 · Prerequisite check
Quick check before you start
1. A test at gives a p-value of 0.03. What is the decision?
- Reject , because
- Fail to reject , because
- Accept , because 0.03 is small
- Reject , because
Show the answer
Reject when the p-value is less than .
- Correct: Reject , because :
- Fail to reject , because :
- Accept , because 0.03 is small:
- Reject , because :
2. If is approximately normal with mean 0.60 and standard deviation 0.0346, which expression gives ?
Show the answer
Standardize the boundary with the distribution's own mean and standard deviation, and keep the direction.
- Correct: :
- :
- :
- :
Part 4 · See it
See it first
Part 5 · Step by step
How it works, step by step
- is true but the sample happens to look extremethe test rejects : a Type I error, with probability
- is true but the sample happens to look ordinarythe test fails to reject : a Type II error, with probability
- A specific alternative value is truethe test rejects with probability power
- The sample size grows (or grows, or the true value is farther from )the curves overlap less or the cutoff is easier to pass, so power rises and falls
Part 6 · Key ideas
Key ideas
- Type I: true, but we reject it (a false alarm). Probability .
- Type II: true, but we fail to reject (a missed effect). Probability , which depends on the true value.
- Describe an error with the condition first: "if the true proportion of all __ is __, but we find (do not find) convincing evidence that ...", then the consequence in context.
- Power : the probability of rejecting when a specific alternative is true.
- More power: larger (best), larger , or a true value farther from . For a fixed , lowering raises .
Part 7 · Misconception
A common mistake
The wrong idea: A Type I error is when the test gets the answer wrong, and a Type II error is when it gets it wrong a second time.
What actually happens: Each is a specific mistake: Type I rejects a true ; Type II fails to reject a false . After a rejection only a Type I error is possible; after a failure to reject, only a Type II error.
Part 8 · Check yourself
Check yourself
Exam-style questions. Anything you miss goes into your review queue.
Table
Lead in household water
A city must replace its old water pipes if more than 10% of its homes have lead levels above a safety limit. The water department tests a random sample of 300 of the city's 40,000 homes and will test against , where is the true proportion of all the city's homes with lead above the limit. If the test finds convincing evidence for , the city replaces the pipes.
| is true () | is true () | |
|---|---|---|
| Reject | Type I error | Correct decision |
| Fail to reject | Correct decision | Type II error |
1. Which describes a Type I error in this context?
- The proportion is 0.10, but the test finds convincing evidence that it is greater
- The proportion is greater than 0.10, but the test does not find convincing evidence
- The proportion is greater than 0.10, and the test finds convincing evidence of that
- The sample proportion turns out to be greater than 0.10
Show the answer
A Type I error is rejecting a true : the true proportion is 0.10, but the test finds convincing evidence that it is greater than 0.10.
- Correct: The proportion is 0.10, but the test finds convincing evidence that it is greater: Right: is true and we reject it.
- The proportion is greater than 0.10, but the test does not find convincing evidence: That is a Type II error: is true and we fail to reject .
- The proportion is greater than 0.10, and the test finds convincing evidence of that: That is a correct decision.
- The sample proportion turns out to be greater than 0.10: An error is about the decision compared with the truth, not about the sample result.
2. Which describes a Type II error in this context?
- The proportion is 0.10, and the test finds convincing evidence that it is greater
- Over 10% of homes are above the limit, but the test finds no convincing evidence
- The test fails to reject when exactly 10% of homes are above the limit
- The department tests too few homes to find anything
Show the answer
A Type II error is failing to reject a false : more than 10% of homes really are above the limit, but the test does not find convincing evidence of it.
- The proportion is 0.10, and the test finds convincing evidence that it is greater: That is a Type I error.
- Correct: Over 10% of homes are above the limit, but the test finds no convincing evidence: Right: is true and we fail to reject .
- The test fails to reject when exactly 10% of homes are above the limit: If is true, failing to reject it is the correct decision.
- The department tests too few homes to find anything: A small sample can make a Type II error more likely, but the error itself is a wrong decision about .
3. What is a consequence of a Type II error here?
- The city spends money replacing pipes that did not need replacing
- The city replaces the pipes, as it should
- The city does not replace the pipes, and residents keep drinking unsafe water
- The city has to test a second random sample
Show the answer
After a Type II error the city does not replace the pipes, even though more than 10% of homes have lead above the limit. Residents keep drinking water with too much lead.
- The city spends money replacing pipes that did not need replacing: That is the consequence of a Type I error.
- The city replaces the pipes, as it should: That follows a correct decision to reject when is true.
- Correct: The city does not replace the pipes, and residents keep drinking unsafe water: Right: the problem exists but the test misses it.
- The city has to test a second random sample: Nothing in the plan calls for a second sample; the decision is made from this test.
4. Build the description of a Type I error and its consequence in this context.
Write the conclusion in context.
Show the answer
State the condition first (what is true), then the wrong decision, then what happens because of it.
- A full-credit answer: A Type I error would occur if the true proportion of all the city's homes with lead above the limit is 0.10, but the test finds convincing evidence that it is greater than 0.10. The city would then spend money replacing pipes that did not need replacing.
Graph
Will customers prefer the new recipe?
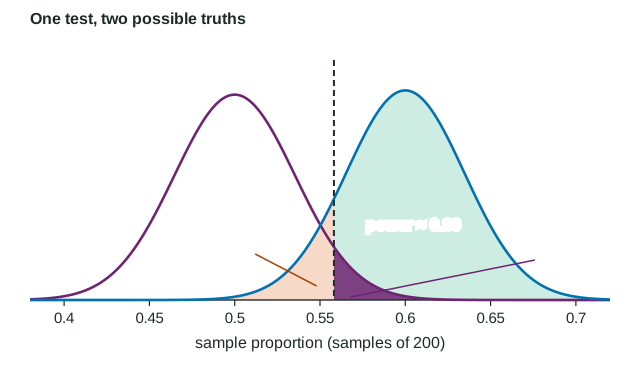
A snack company will switch to a new recipe only if there is convincing evidence that more than half of its customers prefer it. It plans a one-sided test of against at , using a random sample of 200 customers. The test rejects when is 0.558 or more. The figure shows the sampling distribution of if is true, and if in fact .
5. What is the probability that the test makes a Type I error?
- 0.05, the significance level
- 0.11, the area to the left of the cutoff under the curve for
- 0.89, the area to the right of the cutoff under the curve for
- 0.558, the cutoff for rejecting
Show the answer
A Type I error can happen only when is true, and then the test rejects with probability . Here : the dark area to the right of the cutoff under the null curve.
- Correct: 0.05, the significance level: Right: .
- 0.11, the area to the left of the cutoff under the curve for : That area is , the probability of a Type II error when .
- 0.89, the area to the right of the cutoff under the curve for : That is the power of the test against .
- 0.558, the cutoff for rejecting : The cutoff is a value of , not a probability.
6. Suppose that in fact . Find the power of the test: the probability that is 0.558 or more. Give three decimal places.
Type a number. A table answer and a calculator answer are both accepted.
Show the answer
If , is approximately normal with mean 0.60 and standard deviation
- Answer: 0.8873
7. The power against is about 0.89. Which interpretation is correct?
- If 60% prefer it, the test has an 89% chance of finding convincing evidence that over half do
- There is an 89% chance that more than half of the company's customers prefer the new recipe
- About 89% of customers will prefer the new recipe
- If half of customers prefer it, the test has an 89% chance of a Type I error
Show the answer
Power is the probability of correctly rejecting when a particular alternative is true. If 60% of customers really prefer the new recipe, the test has about an 89% chance of finding convincing evidence that more than half do.
- Correct: If 60% prefer it, the test has an 89% chance of finding convincing evidence that over half do: Right: power is the chance of detecting this alternative.
- There is an 89% chance that more than half of the company's customers prefer the new recipe: Power is computed assuming a specific truth, ; it is not a probability about .
- About 89% of customers will prefer the new recipe: The 0.89 is a probability about the test's decision, not a share of customers.
- If half of customers prefer it, the test has an 89% chance of a Type I error: If , the chance of a Type I error is .
Part 9 · Summary
Summary
Part 10 · Up next
What comes next
Part 11 · Connections