You have all the pieces: hypotheses and conditions (setup), the test statistic and p-value. This topic puts them together into one complete significance test and adds the last step, the decision and the conclusion. On the exam this is a whole free-response question, scored part by part, so we write every part out.
The decision: compare the p-value with α
The significance level was chosen before the data. Now compare:
- If the p-value is less than , reject . The result would be too unusual if were true, so there is convincing evidence for .
- If the p-value is greater than , fail to reject . The result is not unusual enough, so there is not convincing evidence for .
"Fail to reject" is not "accept". A large p-value means the data are consistent with , and also with many values near . It never shows that is true, just as a "not guilty" verdict does not show that someone is innocent.
The conclusion has four parts
- Compare, naming both numbers and the inequality: "Because the p-value of 0.0136 is less than , we reject ."
- Evidence: "There is convincing evidence that ..." (or "is not convincing evidence").
- Parameter and direction: "... the true proportion of all ... is less than 0.18." Use the direction word of , even when you fail to reject.
- Context: the population and variable, in the question's words.
Conclusions about the sample ("the sample proportion is less than 0.18") earn nothing: we knew that before the test. Conclusions about being true, and the words "prove" and "accept", lose the point.
A complete test: state, plan, do, conclude
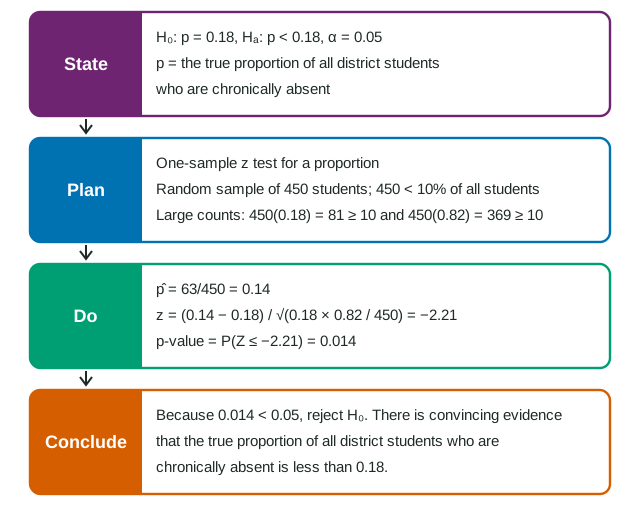
Worked example. Last year 18% of a large district's students were chronically absent. This year the district began a mentoring program. In a random sample of 450 of the district's 21,000 students, 63 are chronically absent. Is there convincing evidence at that the proportion has gone down?
State. , , where is the true proportion of all the district's students who are chronically absent this year. .
Plan. One-sample z test for a proportion. Random: a random sample of 450 students. 10%: 450 is less than 10% of the 21,000 students. Large counts:
Do. .
p-value . (Technology: a 1-proportion z test gives , p-value 0.0136.)
Conclude. Because the p-value of 0.0136 is less than , we reject . There is convincing evidence that the true proportion of all the district's students who are chronically absent this year is less than 0.18.
With instead, the same data give the opposite decision: , so we would fail to reject , and there would not be convincing evidence that the true proportion is less than 0.18. That is why is fixed in advance.
Reading computer output
Software prints a line such as "Test of p = 0.5 vs p > 0.5: X = 532, N = 1000, Sample p = 0.532, Z = 2.02, P-Value = 0.0215". Read the hypotheses from the first part (, ), then compare the p-value with as usual. You still have to state the hypotheses with the parameter defined, check the conditions and write the conclusion; output is not work.
What a test can and cannot tell you
- Generalize: with a random sample, the conclusion applies to the population sampled (all the district's students).
- Cause: only random assignment to treatments supports cause and effect. The mentoring study compares this year with last year with no randomly assigned comparison group, so it cannot show that the program caused the drop; other changes could explain it.
- Tests and intervals agree: a two-sided test at almost always rejects when is outside the 95% interval and fails to reject when it is inside. (The test's standard deviation uses and the interval's standard error uses , so in rare borderline cases the two can disagree.) A one-sided test at 0.05 goes with a 90% interval in the same way. The interval adds something the test does not: how far from the true proportion plausibly is.