An interval estimates how far apart two proportions are. A test answers a sharper question: is there convincing evidence that they differ at all, or differ in one direction? Before computing anything, a test needs a careful setup. This topic covers the setup for comparing two proportions: the procedure, the hypotheses, the pooled proportion and the conditions.
Naming the procedure
When two groups are compared on a yes or no outcome, the parameter is a difference of two proportions, , and the procedure is a two-sample z test for . Name it in full on the exam. "A z test" alone is incomplete.
The two groups can come from two independent random samples (teens in 2016 and teens in 2026) or from random assignment in an experiment (households given new or old recycling bins). Two measurements on the same people, like before and after on the same players, are linked, so this test does not fit.
Hypotheses
The null hypothesis is "no difference": , which is the same as . The alternative matches the question:
| The question asks whether | Alternative |
|---|---|
| group 1's proportion is higher | |
| group 1's proportion is lower | |
| the proportions differ, or "have changed" |
Three rules. Hypotheses are about parameters (), never statistics (). Define each parameter in context right after them. And choose the direction from the question, before looking at the data; picking because the sample came out higher makes the evidence look stronger than it is.
Why the test pools the samples
A significance test asks: if were true, how surprising would our data be? So every calculation is done as if were true. If , both samples come from populations with the same proportion, and the best estimate of that common value uses all the data at once. That is the pooled proportion:
Pool the counts, not the proportions. Averaging and gives the wrong value whenever the sample sizes differ, because it lets the smaller sample count as much as the larger one. A confidence interval does not pool, because it makes no assumption that the proportions are equal.
Conditions
- Random: two independent random samples, or two groups formed by random assignment.
- 10%: when sampling without replacement, each sample is less than 10% of its population.
- Large counts: because the test assumes , use : , , and are each at least 10.
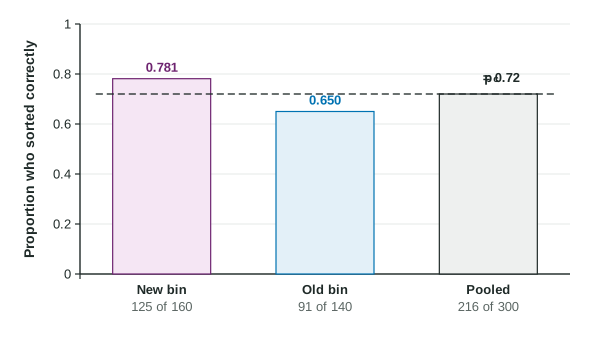
Worked example. A city randomly assigns 160 volunteer households a new recycling bin and 140 the old bin. Afterward, 125 of the new bin households and 91 of the old bin households sort correctly. Set up a test of whether the new bin increases correct sorting.
Procedure: a two-sample z test for .
Hypotheses: and , where is the true proportion of households like these that would sort correctly with the new bin and is the true proportion that would with the old bin.
Pooled proportion:
Conditions. Random: the bins were randomly assigned to the households. 10%: not needed, because the households were not sampled from a larger population; they were volunteers, so any conclusion applies to households like them. Large counts: , , and are each at least 10.
The figure shows the three proportions from this example. The pooled value, 0.72, is the single proportion both groups would share if the bin made no difference. The next topic uses it to build the test statistic and the p-value.