Setting Up a Test for the Difference Between Two Population Proportions
A two-sample z test for p_1 − p_2 starts from H_0:p_1 − p_2 = 0 and an alternative chosen from the question.
Part 1 · Hook
Why this matters
Part 2 · Before you start
What this builds on
Part 3 · Prerequisite check
Quick check before you start
1. Which is a correct null hypothesis for one proportion?
Show the answer
A null hypothesis is about the parameter, with an equals sign.
- Correct: :
- :
- :
- :
2. For a test of with , which large counts check is right?
- and are at least 10
- is at least 30
- is at least 10
- is at least 10
Show the answer
A test checks large counts with the null value .
- Correct: and are at least 10:
- is at least 30:
- is at least 10:
- is at least 10:
Part 4 · See it
See it first
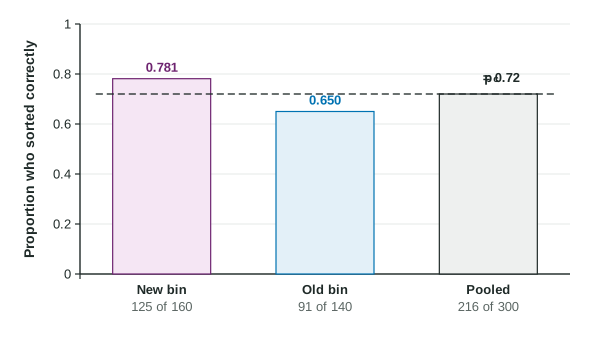
Part 5 · Step by step
How it works, step by step
- The question compares two groups on a yes or no outcomethe parameter is , and the procedure is a two-sample z test
- The null hypothesis says there is no difference, and says , or as the question asks, chosen before seeing the data
- If is true, both samples come from populations with one common proportionestimate it by pooling:
, total successes over total sample size - The test is computed as if were truecheck large counts with : , , , each at least 10, plus random and 10%
Part 6 · Key ideas
Key ideas
- Hypotheses: and , or , with each defined as a true proportion in context.
- Pooled proportion:
, the combined successes over the combined sample size. Never the average of and . - Conditions: two independent random samples or randomly assigned groups; 10% for each sample; large counts with .
- Name it in full: "a two-sample z test for ".
Part 7 · Misconception
A common mistake
The wrong idea: The pooled proportion is the average of the two sample proportions.
What actually happens: Pool the counts, not the proportions: add the successes and divide by the total sample size. With unequal sample sizes the two answers differ, and only the pooled counts give the right estimate.
Part 8 · Check yourself
Check yourself
Exam-style questions. Anything you miss goes into your review queue.
Table
New recycling bins
| Bin | Sorted correctly | Households | Sample proportion |
|---|---|---|---|
| New | 125 | 160 | 0.781 |
| Old | 91 | 140 | 0.650 |
1. Which hypotheses match the city's question?
- ,
- ,
- ,
,
Show the answer
The null is no difference; the alternative is the direction of the research question.
- Correct: , : Right: the null says no difference; the alternative says the new bin is better, the direction the city asked about.
- , : The null hypothesis is the "no difference" claim, with an equals sign; the alternative is what we look for evidence of.
- , : The city asked whether the new design increases correct sorting, a one-sided question. Choose the direction before seeing the data.
, : Hypotheses are about parameters. We know the sample proportions differ; the question is about the true proportions.
2. How should be defined in context?
- The proportion of the 160 new bin households in this study that sorted correctly
- The chance that a household chosen at random picks the new bin over the old one
- The number of households in the study that sorted correctly with the new bin
- The true share of such households that would sort correctly with the new bin
Show the answer
Define each parameter as a true proportion, in context.
- The proportion of the 160 new bin households in this study that sorted correctly: That is , a statistic we already know.
- The chance that a household chosen at random picks the new bin over the old one: Households did not choose; the city assigned the bins at random.
- The number of households in the study that sorted correctly with the new bin: A proportion is a fraction of a group, not a count.
- Correct: The true share of such households that would sort correctly with the new bin: Right: in an experiment, the parameter is the proportion of subjects like these who would succeed with that treatment.
3. What is the pooled proportion for this test? Give three decimal places.
Type a number. A table answer and a calculator answer are both accepted.
Show the answer
- Answer: 0.72
4. Which statement correctly checks the large counts condition for this test?
- and are each at least 10
- Both and are greater than 0.10
- , , and are each at least 10
- The total of 300 households is at least 30
Show the answer
For the test, , , , are each at least 10.
- and are each at least 10: Nothing in the problem is 0.5. The null hypothesis says the proportions are equal, and estimates that common value.
- Both and are greater than 0.10: That is not the condition. Each group needs at least 10 expected successes and failures.
- Correct: , , and are each at least 10: Right: a test assumes , so the four counts use the pooled proportion .
- The total of 300 households is at least 30: Comparing with 30 is a rule for means. Check counts against 10.
5. A researcher looks at her data, sees that , and then writes . What is wrong?
- The direction of must come from the question, not the data
- should say
- should be written about the sample proportions,
- One-sided alternatives are not allowed for two proportions
Show the answer
Set hypotheses from the question, before the data.
- Correct: The direction of must come from the question, not the data: Right: choosing a one-sided test because of the sample result makes evidence look stronger than it is.
- should say : The equality belongs in .
- should be written about the sample proportions, : Hypotheses are about parameters, never sample statistics.
- One-sided alternatives are not allowed for two proportions: One-sided alternatives are fine when the question has a direction.
6. A clinic randomly assigns 30 patients to each of two treatments for a rare reaction. In all, 6 of the 60 patients have the reaction. Why is the large counts condition not met for a two-sample z test?
- is more than 10
- The groups have the same size, 30
- Random assignment was used instead of random sampling
- , so is less than 10 in each group
Show the answer
Each of the four counts with must reach 10.
- is more than 10: That count passes. It is the other count, , that fails.
- The groups have the same size, 30: Equal groups are fine. The small number of reactions expected in each group is the problem.
- Random assignment was used instead of random sampling: Random assignment satisfies the random condition. The counts are the problem.
- Correct: , so is less than 10 in each group: Right: with so few reactions overall, each group expects only 3, too few for a normal model.
Part 9 · Summary
Summary
Part 10 · Up next
What comes next
Part 11 · Connections