Carrying Out a Test for the Difference Between Two Population Proportions
A two-sample z test standardizes the observed difference with the pooled standard error, z = (p-hat_1 − p-hat_2)/(√(p_c(1 − p_c)(1/(n_1) + 1/(n_2)))) , finds the p-value in the direction of H_a , compares it with α , and concludes about the true proportions in context, never accepting H_0 .
Part 1 · Hook
Why this matters
Part 2 · Before you start
What this builds on
Part 3 · Prerequisite check
Quick check before you start
1. For and , the p-value is the area
- to the right of 2.10
- to the left of 2.10
- in both tails beyond 2.10
- between and 2.10
Show the answer
A "greater than" alternative uses the right tail.
- Correct: to the right of 2.10:
- to the left of 2.10:
- in both tails beyond 2.10:
- between and 2.10:
2. What is the pooled proportion for 30 of 100 and 50 of 150?
Show the answer
- Correct: :
- :
- :
- :
Part 4 · See it
See it first
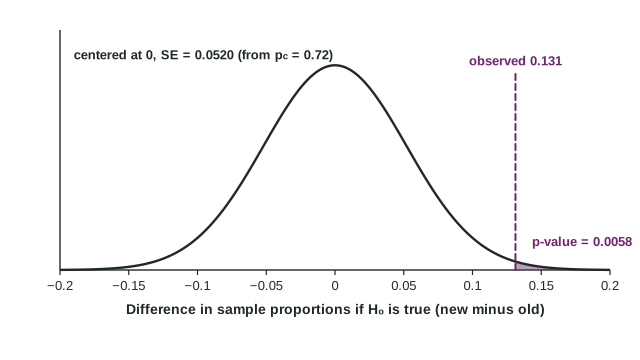
Part 5 · Step by step
How it works, step by step
- Assume : the two true proportions are equalthe difference is centered at 0, with standard error
- Standardize the observed difference
counts how many standard errors it lies from 0 - Find the area beyond in the direction of (both tails for )that area is the p-value: how often chance alone gives a difference this extreme
- Compare the p-value with reject or fail to reject , then state convincing evidence (or not) for about the true proportions, in context
Part 6 · Key ideas
Key ideas
- Test statistic:
, with . - p-value: area beyond in the direction of ; double one tail for a two-sided test.
- Conclusion: "Because the p-value of ... is less than (greater than) = ..., we reject (fail to reject) . There is (is not) convincing evidence that the true proportion ..."
- Reject: a Type I error is possible. Fail to reject: a Type II error is possible.
Part 7 · Misconception
A common mistake
The wrong idea: A p-value of 0.13 means there is a 13% chance that the two proportions are equal.
What actually happens: The p-value is computed assuming the proportions are equal. It is the probability of a difference at least as extreme as the one observed if were true, not the probability that is true.
Part 8 · Check yourself
Check yourself
Exam-style questions. Anything you miss goes into your review queue.
Table
New recycling bins: the test
| Bin | Sorted correctly | Households | Sample proportion |
|---|---|---|---|
| New | 125 | 160 | 0.781 |
| Old | 91 | 140 | 0.650 |
| Both | 216 | 300 |
1. Write the expression for the test statistic , with the values substituted, then give its value to two decimal places.
Type the expression as on the exam, with the values substituted.
Show the answer
- Answer:
2. What is the p-value of the test? Give four decimal places.
Type a number. A table answer and a calculator answer are both accepted.
Show the answer
, the area to the right of under the standard normal curve.
- Answer: 0.0058
3. State the conclusion of the test in context.
Write the conclusion in context.
Show the answer
Compare, then evidence, direction and parameter in context.
- A full-credit answer: Because the p-value of 0.0058 is less than 0.05, we reject the null hypothesis. There is convincing evidence that the true proportion of all households like these that sort their recycling correctly is greater with the new bin than with the old bin.
4. In this study, what would a Type I error be?
- Finding the new bin helps when it truly makes no difference
- Getting a sample proportion of 0.781 by chance
- Assigning the bins without random assignment
- Concluding the new bin makes no difference when it really does help
Show the answer
Type I: is true, but we reject it.
- Correct: Finding the new bin helps when it truly makes no difference: Right: a Type I error rejects a true , here finding convincing evidence that the new bin helps when it makes no difference.
- Getting a sample proportion of 0.781 by chance: A sample result by itself is not an error. Errors are about the decision made from it.
- Assigning the bins without random assignment: That is a flaw in design, not a Type I or Type II error.
- Concluding the new bin makes no difference when it really does help: That is a Type II error: failing to find a real effect.
5. Two studies find the same sample proportions, 0.30 and 0.42, but the second uses samples four times as large. How does its test statistic compare?
- About twice as large, so the p-value is smaller
- The same, since the proportions are the same
- About four times as large, since the samples are four times as large
- About half as large in size
Show the answer
With the same difference, larger samples give a larger and a smaller p-value.
- Correct: About twice as large, so the p-value is smaller: Right: the standard error is divided by , so doubles and the evidence is stronger.
- The same, since the proportions are the same: The proportions set the numerator; the sample sizes set the standard error in the denominator.
- About four times as large, since the samples are four times as large: The standard error shrinks by , not by 4, so doubles.
- About half as large in size: Larger samples give smaller standard errors and so larger values, not smaller.
6. A test of gives a p-value of 0.21, so the researchers fail to reject . Which error could they have made?
- Both a Type I and a Type II error
- A Type I error: they may have rejected a true
- A Type II error: missing a real difference
- No error, since the p-value is large
Show the answer
Fail to reject: the possible error is Type II.
- Both a Type I and a Type II error: One decision allows one kind of error: fail to reject, so only Type II.
- A Type I error: they may have rejected a true : They did not reject , so a Type I error is not possible here.
- Correct: A Type II error: missing a real difference: Right: failing to reject a false is a Type II error.
- No error, since the p-value is large: A large p-value does not show is true; a real difference may have gone undetected.
Part 9 · Summary
Summary
Part 10 · Up next
What comes next
Part 11 · Connections