A confidence interval does two jobs. It estimates a parameter, and it lets you judge a claim about that parameter. This topic is about the second job for means, and about what controls how wide an interval is. The reasoning is the same as for proportions in Unit 3; only the parameter has changed.
Reading an interval
Every interval has the form point estimate margin of error. Given the two ends, you can recover both pieces:
- the point estimate is the center, , which is (or for paired data);
- the margin of error is half the width, .
The values inside the interval are the plausible values for the true mean. Values outside are not plausible at that confidence level.
Judging a claim
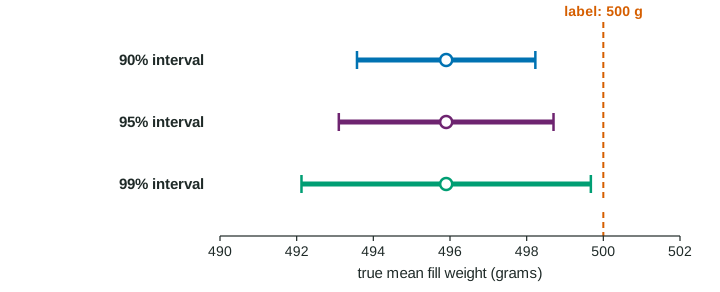
A cereal maker labels boxes "500 grams". An inspector weighs a random sample of 30 boxes from one day's production (invented data): g, g, and the dotplot shows no strong skew or outliers. The 95% t interval is
Worked example 1. Does the interval give convincing evidence that the true mean fill weight differs from 500 grams?
Look at where 500 sits. Every value in the interval, from 493.10 to 498.70, is below 500. So 500 is not a plausible value for the true mean.
Conclusion: Because every value in the interval from 493.10 to 498.70 g is less than 500, the interval gives convincing evidence that the true mean fill weight of all boxes filled that day is less than 500 grams.
Notice the sentence names the parameter in context ("the true mean fill weight of all boxes filled that day"), uses evidence language, and does not claim proof. It also does not rely on the sample mean alone. A sample mean of 495.9 below 500 could be chance; the interval is what accounts for chance.
Worked example 2. A tutoring company claims its program raises scores by more than 10 points on average. For a random sample of 40 students, the 95% interval for the mean improvement (after minus before) is from 7.4 to 15.0 points. Is the claim supported?
Look at where 10 sits: inside the interval. Values above 10 are plausible, but so are values below 10, such as 8 or 9.
Conclusion: Because 10 is in the interval from 7.4 to 15.0 points, the interval does not give convincing evidence that the true mean improvement for students who complete the program is greater than 10 points.
A second question has a different answer. Is there evidence of any improvement? Now the value to check is 0. Every value in the interval is greater than 0, so the interval gives convincing evidence that the true mean improvement is greater than 0.
Two traps. First, "inside the interval" does not mean "true". If a manager says the true mean fill was 497 grams, the interval says 497 is plausible, but so are 494 and 498.5. Second, an interval for a mean says nothing about individual values. It is wrong to say "95% of students gain between 7.4 and 15.0 points"; single students' gains vary far more than the mean does.
What controls the interval width
The interval width is twice the margin of error:
Each piece has a job.
| Change | Effect on the width | Why |
|---|---|---|
| Higher confidence level | wider | larger (2.756 for 99% at df 29, against 2.045 for 95%) |
| Larger sample size | narrower | shrinks; four times the data roughly halves the width |
| More variable data | wider | larger |
For the cereal boxes, the 99% interval is
With a fixed sample, confidence and precision trade against each other: a 90% interval is narrower, but the method captures the true mean in only about 90% of samples. The way to gain precision without losing confidence is more data.
Intervals and two-sided tests agree
A 95% confidence interval contains exactly the values that a two-sided significance test at would not reject. So if 500 is outside the 95% interval, a two-sided test of "the true mean is 500" at the 0.05 level rejects that null hypothesis. The interval gives more: it also shows how far from 500 the mean plausibly is. The next topic sets up that test directly.