An interval for a difference of two means, , carries more information than a yes or no. It tells you whether there is convincing evidence of a difference, which direction it goes, and how large it plausibly is. That last part lets you judge whether the difference actually matters.
Is 0 in the interval?
For a difference, the key value is 0: means the two true means are equal. So the first question about any interval for is where 0 sits.
| Interval | What it shows |
|---|---|
| every value greater than 0 | convincing evidence that |
| every value less than 0 | convincing evidence that |
| 0 inside | no convincing evidence of a difference; differences in both directions are plausible |
Worked example 1. Sixty student volunteers were randomly assigned, 30 each, to take a timed reading test with noise-canceling headphones (H) or without (N) in a noisy room (invented data). Headphones: , ; none: , . The 95% two-sample t interval is
from 0.72 to 8.28 points. Does it give convincing evidence that headphones raise the mean score?
Conclusion: Because every value in the interval from 0.72 to 8.28 is greater than 0, the interval gives convincing evidence that the true mean reading score is higher with headphones than without, for students like these.
Scope: the students were randomly assigned, so the difference can be credited to the headphones. They were volunteers, not a random sample, so the result applies to students like them.
Worked example 2. Independent random samples of one-bedroom listings in two cities give a 99% interval for (true mean monthly rent, city A minus city B) from to 130 dollars.
Conclusion: Because 0 is in the interval from to 130 dollars, the interval does not give convincing evidence that the true mean monthly rents of one-bedroom listings differ between cities A and B.
What the interval does not say: that the rents are the same. City A could plausibly cost up to 130 dollars more on average, or city B up to 45 dollars more.
Statistically significant is not the same as important
A difference is statistically significant when chance alone is not a plausible explanation: here, when 0 is outside the interval. Practical significance asks a different question: is the difference big enough to matter to someone?
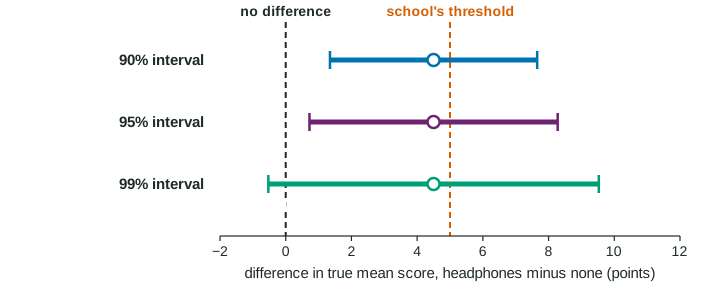
The school in worked example 1 will only buy headphones if they raise the mean score by more than 5 points. The 95% interval runs from 0.72 to 8.28. Gains below 5 are plausible, and so are gains above 5. So the interval gives convincing evidence of some gain, but not convincing evidence of a gain big enough for the school. The figure shows the 5-point line inside every interval.
The opposite can happen too. With two random samples of 20,000 phones each, a 95% interval for the difference in mean battery life might run from 0.03 to 0.09 hours. That excludes 0, so the difference is statistically significant, but it is at most about 5 minutes: probably not practically significant. Very large samples make tiny differences detectable.
Worked example 3. A randomized experiment gives a 95% interval for the true mean weight loss on diet A minus diet B from 0.4 to 1.1 kilograms over a year. A doctor thinks 3 kilograms is the smallest change worth a patient's effort. Summarize.
Every value is greater than 0, so there is convincing evidence that diet A produces more weight loss on average. Every value is also far below 3 kilograms, so the advantage is not large enough to matter by the doctor's standard.
Three habits
- State the order. An interval for is the interval for with the signs flipped (from to ); the conclusion is the same.
- Use one interval for the difference, not two separate intervals. Two intervals can overlap a little even when the interval for the difference excludes 0, because the standard error of a difference is smaller than the sum of the two standard errors.
- Link to tests. A 95% interval for excludes 0 exactly when a two-sided test of at rejects. A wider interval (99%) can contain 0 when a narrower one (95%) does not, as the figure shows.