Sine and cosine are functions: put in an angle, get out a number. This page draws their graphs straight from the unit circle, reads off their key features, and describes how they change, using the same rate of change and concavity language you used for polynomials and exponentials.
Tracing sine from the circle
Let a point travel counterclockwise around the unit circle, starting at . After it has turned through radians, its height is . Plot that height against :
- from to the point climbs from height to the top, height ;
- from to it comes back down to ;
- from to it drops to the bottom, ;
- from to it rises back to , where it started.
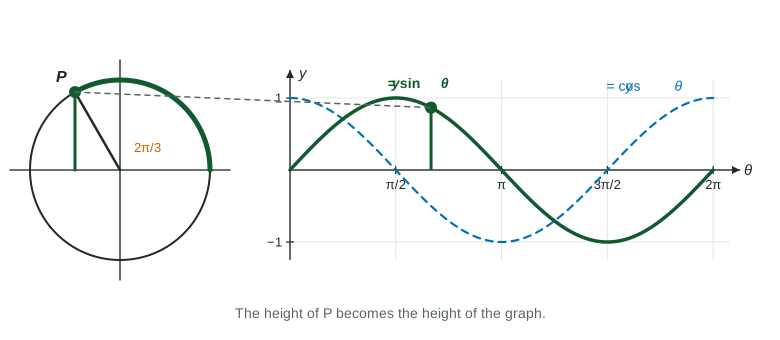
After the point repeats its trip, so the graph repeats: has period . Turning backwards (negative ) continues the same wave to the left. The height never goes above or below , so the range is .
Cosine: the horizontal position
is the point's -coordinate. It starts at , falls to at , reaches at , returns to at and to at . The shape is exactly the sine wave, moved to the left: cosine reaches each value a quarter turn earlier than sine does. In symbols, .
| Feature | ||
|---|---|---|
| Domain, range | all reals, | all reals, |
| Period | ||
| Value at | ||
| Highest points | ||
| Zeros | ||
| Increasing on | , plus | , plus |
Here is any integer. To sketch either graph by hand, plot the five key points of one cycle and join them with a smooth wave, flat at the top and bottom.
How fast sine changes
Think about the point on the circle. Near the right side of the circle (angles near ) it moves almost straight up, so its height changes fast. Near the top it moves almost sideways, so its height barely changes. The graph shows the same thing: steep at the zeros, flat at the highest and lowest points.
Worked example 1. Use exact values to compare the average rates of change of on , and , and describe the graph on .
Each interval has length . The average rate of change on is
On :
All three are positive, so sine is increasing. Over equal intervals they get smaller, so the rate of change of sine is decreasing: the graph is concave down on .
The pattern holds everywhere. Sine is concave down where it is above the axis, on , and concave up where it is below, on . The concavity changes at the zeros, where the graph is steepest. Cosine behaves the same way: concave down on , where , and concave up on .
Worked example 2. Describe how changes on .
The values go from up to , so cosine is increasing. The graph is below the axis, so it is concave up: the rate of change of cosine is increasing too, from at the lowest point toward its steepest at the zero .
Notice the two separate statements: one about how the function changes (increasing), one about how its rate of change changes (increasing). Keep them apart; they will be asked for separately when you model periodic situations.
Reading values from the graphs
Because the graphs come from the circle, every exact value you know is a point on them: on the sine curve, on the cosine curve. The symmetry of the circle shows up too. Sine takes the same value at and , so its graph on is symmetric about .