Sine and Cosine Function Graphs
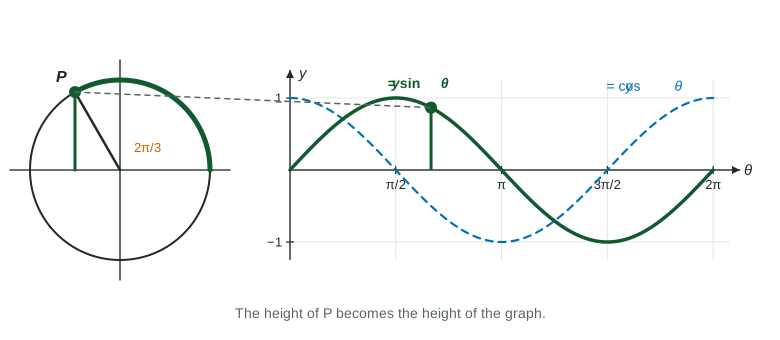
The graph of y = sin θ is the height of the point at angle θ on the unit circle; y = cos θ is its horizontal position.
Part 1 · Hook
Why this matters
Part 2 · Before you start
What this builds on
Part 3 · Prerequisite check
Quick check before you start
1. What is ?
Show the answer
Quadrant III, reference angle : the height is .
- Correct: :
- :
- :
- :
2. A function has period . Over any interval of length , what is its average rate of change?
- It depends on the interval
Show the answer
The output after one period equals the output at the start, so the change in output is .
- Correct: :
- :
- :
- It depends on the interval:
Part 4 · See it
See it first
Part 5 · Step by step
How it works, step by step
- Let the angle be the input and the height of the point on the unit circle the outputyou get : at , up to at , back to at , down to at , back to at
- Use the horizontal position as the output insteadyou get : at the same five inputs, the sine graph moved to the left
- One more full turn brings the point backboth graphs repeat every and stay between and
- Near the top or bottom of the circle the height changes slowly; near the -axis it changes fastthe rate of change of is largest in size at the zeros, and the graph is concave down where and concave up where
Part 6 · Key ideas
Key ideas
- Both graphs have domain all real numbers, range and period .
- Five key points per cycle: sine
; cosine . - Sine is zero at every multiple of ; cosine is zero at plus every multiple of .
- Each graph is concave down above the -axis and concave up below it, so its rate of change is decreasing where the graph is above the axis.
Part 7 · Misconception
A common mistake
The wrong idea: The sine graph is made of curved arches that are steepest at the top, like a hill.
What actually happens: At a highest point the graph is flat: the point on the circle is moving sideways, not up. The graph is steepest where it crosses the -axis, where the point on the circle moves straight up or down.
Part 8 · Check yourself
Check yourself
Exam-style questions. Anything you miss goes into your review queue.
Graph
The graph of
1. On which interval is decreasing?
Show the answer
The graph falls from at to at , then rises.
- Correct: : From the highest point to the lowest point: .
- : On the graph rises from back to .
- : This is where the graph is below the axis, not where it falls; it rises on .
- : Cosine falls on but rises on , so it is not decreasing on this whole interval.
2. On which interval is the graph of concave up?
Show the answer
The graph bends upward where it is below the axis, between the zeros and .
- Correct: : Between the two zeros, around the lowest point, the graph is concave up.
- : Near the highest point the graph bends downward: concave down.
- : This is where cosine increases. On it is concave down again.
- : This is where cosine decreases; the bend changes at .
3. What is the average rate of change of on ?
No calculator. Type the exact value (a fraction, π, e or a root is fine).
Show the answer
- Answer: ≈ -0.637
4. The average rates of change of on and on are about and . Which describes on ?
- Decreasing, and the rate of change is decreasing
- Decreasing, and the rate of change is increasing
- Increasing, and the rate of change is decreasing
- Decreasing, and the rate of change is constant
Show the answer
Both rates are negative, so cosine is decreasing. Over equal intervals the rate goes from to , a smaller number, so the rate of change is decreasing: concave down.
- Correct: Decreasing, and the rate of change is decreasing: Negative rates that get more negative: decreasing, concave down.
- Decreasing, and the rate of change is increasing: , so the rate went down, not up.
- Increasing, and the rate of change is decreasing: The rates are negative, so the outputs fall.
- Decreasing, and the rate of change is constant: The two rates differ, so the rate is not constant.
5. What is the range of ?
Show the answer
Sine is the height of a point on a circle of radius 1, so it goes from at the bottom to at the top.
- Correct: : From the bottom of the unit circle to the top.
- : Below the -axis the height is negative, down to .
- : This is one period of inputs, not the outputs.
- : This is the domain: any angle can go in, but the outputs stay between and .
6. On which intervals is increasing? Select all that apply.
Show the answer
Sine rises from its lowest point to its highest point: from to , and again one period later, from to .
- Correct: : From at up to at .
- Correct: : The same interval shifted by .
- : Here sine falls from to .
- : Sine rises on but falls on .
Part 9 · Summary
Summary
Part 10 · Up next
What comes next
Part 11 · Connections