Many things in the world come back to where they started and then do it all again: the depth of water at a dock, the brightness of a lighthouse, the pressure in an artery, the hours of daylight across the year. Functions that model them are periodic. This page shows what that word means, how to find the period, and how one cycle tells you everything else about the function.
What periodic means
A function is periodic if its outputs repeat at regular intervals of input. In symbols, there is a positive number with
for every input .
The smallest positive number that works is the period of . If works, so do , and every other whole multiple, which is why the definition asks for the smallest one.
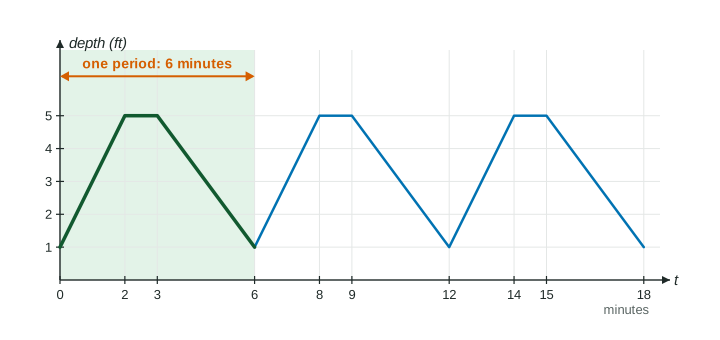
The water tank in Figure 1 fills and drains on a schedule. In each cycle the depth rises from 1 foot to 5 feet in 2 minutes, holds for 1 minute, then drains back to 1 foot over 3 minutes. Then the cycle starts again, so the depth is periodic with period 6 minutes.
Finding the period
Look for the length of the smallest piece of graph (or table) that repeats exactly. A safe way is to pick a distinctive point, such as a highest point, and measure to the next point that looks exactly the same.
Be careful with two inputs that share an output. In Figure 1 the depth is 3 feet at (on the way up) and again at (on the way down). Those inputs are apart, but is not the period: just after the depth is rising, and just after it is falling. The pattern only matches again 6 minutes later.
Building the graph from one cycle
A full cycle is any interval of input one period long. Since , the graph on is the graph on moved units to the right. The same works to the left: too.
Worked example 1. A function has period . On one cycle, rises in a straight line from to , falls in a straight line to , then rises to . Sketch on and find where it is decreasing.
Copy the cycle to and by adding and then to every input. The highest points move from to and ; the lowest from to and .
In the first cycle decreases on . Add whole periods: also decreases on and .
Outputs far from the known cycle
To find at an input far away, subtract (or add) whole periods until the input lands in the cycle you know. Each step does not change the output.
Worked example 2. For the tank, find the depth at minutes and at minutes.
, so subtract seven periods: depth at = depth at . On the first cycle the depth at is on the draining piece, which falls feet in minutes from feet at : depth feet.
For , add one period: depth at = depth at feet. Subtracting from a negative input the other way would move you further from the cycle.
How a periodic function changes over a cycle
Everything you can say about one cycle repeats every period: where increases and decreases, where the graph is concave up or concave down, where the highest and lowest outputs occur. The rates of change repeat too. The average rate of change of on equals its average rate of change on .
One rate is always the same. Over any interval that is exactly one period long, the output returns to its starting value, so
average rate of change on
Worked example 3. A building's power use , in kilowatts, repeats every 24 hours. A table gives , and . Describe how changes on .
The average rate of change of on is kilowatts per hour, the slope of the secant line through and . On it is kilowatts per hour.
Both rates are positive, so is increasing. Over equal intervals the rates get smaller, so the rate of change of is decreasing and the graph is concave down there. The same is true on , one day later.
A checklist for periodic questions
| Question | What to do |
|---|---|
| What is the period? | Measure the smallest input interval after which the whole pattern repeats. |
| What is at a far input? | Add or subtract whole periods to land in the known cycle. |
| Where is increasing? | Find the intervals in one cycle, then add multiples of the period. |
| Average rate over a full period? | Always : the output ends where it began. |
The coming topics build the most important periodic functions of all from a circle. Every idea on this page, the period, one cycle, and how the function changes within it, carries straight over.