Precalculus studies how quantities change together. When the date changes, the depth of a pond changes; when time passes, coffee cools. This page gives you the words for that joint change, the words the exam expects: increasing, decreasing, rate of change, concave up and concave down. You will use them in every unit.
Quantities that change together
When two quantities are linked, we say they covary: a change in one goes with a change in the other. A function makes the link precise. The input is the independent variable, the one you choose or that runs on its own, like time. The output is the dependent variable, the one that depends on it, like temperature.
To describe covariation, compare outputs. As goes from to to , the outputs of go . The input rises and the output falls, by for each step of .
Increasing and decreasing
A function is increasing on an interval if larger inputs always give larger outputs there: for any in the interval, . It is decreasing on an interval if larger inputs always give smaller outputs: .
On a graph, read from left to right. Rising means increasing; falling means decreasing. The definition is about outputs, so check it with numbers when you have a table: is decreasing, but is not decreasing on the whole interval, because two inputs share the output .
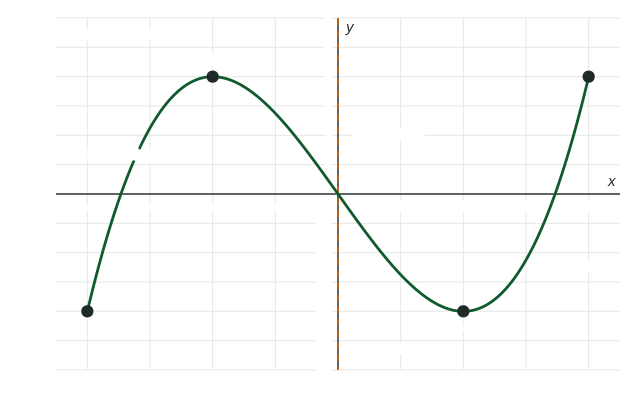
Whether you write or for where decreases is not tested: either is accepted. Endpoints still matter for domains and ranges.
Where a function switches from decreasing to increasing, its output is lower than at nearby inputs, as the figure shows at . Where it switches from increasing to decreasing, as at , its output is higher than at nearby inputs.
Rate of change
The rate of change of a function compares how much the output changes with how much the input changes. When the input goes up by and the output goes up by , the output is changing five times as fast as the input. A positive rate of change means input and output move the same way; a negative rate means they move opposite ways.
With a table at equal input steps, compare the changes in output directly. They tell you both the direction and how fast.
Worked example 1. Coffee is poured and cools. Its temperature , in degrees Fahrenheit, is at minutes. Describe how changes.
Changes over each -minute step: , then , , .
Every change is negative, so is decreasing. The changes go : they increase (toward ). Over equal steps, that means the rate of change of is increasing.
Concavity: how the rate of change changes
A graph is concave up on an interval when its rate of change is increasing there: it bends upward, like a cup. It is concave down when its rate of change is decreasing: it bends downward, like a cap.
| Outputs over equal steps | Direction | Rate of change | Concavity |
|---|---|---|---|
| (changes ) | increasing | increasing | concave up |
| (changes ) | increasing | decreasing | concave down |
| (changes ) | decreasing | increasing | concave up |
| (changes ) | decreasing | decreasing | concave down |
Direction and concavity answer two different questions. Direction asks whether the output goes up or down. Concavity asks whether the rate of change goes up or down. Say each one with its own subject: " is decreasing, and the rate of change of is increasing." Do not merge them into the calculus phrase "decreasing at an increasing rate"; the exam expects the two separate statements.
Sketching from a description
A word description gives you both properties. Turn each sentence into one of them.
Worked example 2. Water pours at a steady rate into a vase that is narrow at the bottom and wide at the top. Sketch the height of the water against time.
The height keeps rising, so is increasing. Each second adds the same volume, but higher up the vase is wider, so the same volume raises the water less: the rate of change of is decreasing. The graph rises and flattens out, concave down.
A car that starts from rest and speeds up gives the opposite shape for its distance: increasing and concave up, since it covers more ground each second.
Zeros still mean the same thing here: where the graph meets the -axis, the output is .