Change in Tandem
Two quantities that change together are described by direction and by how fast.
Part 1 · Hook
Why this matters
Part 2 · Before you start
What this builds on
Part 3 · Prerequisite check
Quick check before you start
1. For , what is ?
Show the answer
.
- Correct: :
- :
- :
- :
2. Which interval is ?
Show the answer
Parenthesis at the excluded end , bracket at the included end .
- Correct: :
- :
- :
- :
Part 4 · See it
See it first
Part 5 · Step by step
How it works, step by step
- For inputs in an interval, every time is increasing on that interval (and decreasing if every time)
- The output changes by more over each equal step of inputthe rate of change is increasing and the graph is concave up
- The output changes by less over each equal step (or by more negative amounts)the rate of change is decreasing and the graph is concave down
- A function switches from decreasing to increasingits outputs reach a lowest value there, as the pond does at
Part 6 · Key ideas
Key ideas
- Increasing on an interval: larger inputs give larger outputs there. Decreasing: larger inputs give smaller outputs.
- The rate of change compares the change in output with the change in input: how fast the output moves.
- Concave up: the rate of change is increasing (the graph bends upward). Concave down: the rate of change is decreasing.
- Direction and concavity are separate: a function can be decreasing and concave up, like cooling coffee.
Part 7 · Misconception
A common mistake
The wrong idea: If a function is decreasing, its rate of change must be decreasing too.
What actually happens: The coffee's temperature falls, but its drops shrink: . The temperature is decreasing while its rate of change is increasing, so the graph is concave up.
Part 8 · Check yourself
Check yourself
Exam-style questions. Anything you miss goes into your review queue.
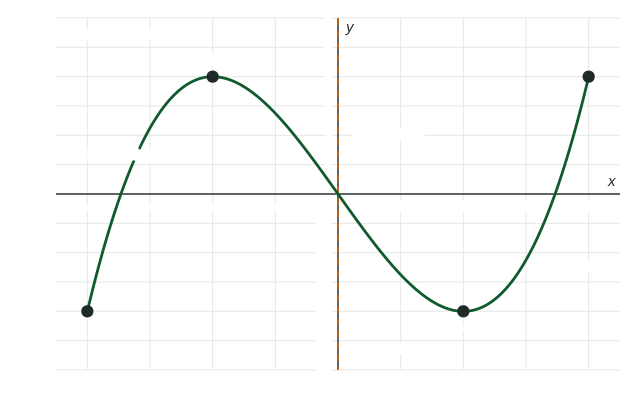
Graph
Depth of a pond
1. The graph shows the depth of a pond, in feet, months after the start of a year, for . On which interval is increasing?
Show the answer
is increasing on an interval when a larger input always gives a larger output there. The depth climbs from to and falls on both sides.
- : On the graph falls from to : later times have smaller depths, so is decreasing there.
- Correct: : Right: from to , a later time always gives a greater depth.
- : rises only until ; on it falls from to .
- : is a depth (an output). The interval is in , the input.
2. Which describes on the interval ?
- is increasing and concave down.
- is increasing and concave up.
- is decreasing and concave down.
- is decreasing and concave up.
Show the answer
Two separate questions: is the output rising or falling (increasing), and is the rate of change rising or falling (concavity)? On the depth rises, but it rises more slowly each month, so the graph is concave down.
- Correct: is increasing and concave down.: Right: the depth still rises, but the graph bends downward, so the rate of change of is decreasing.
- is increasing and concave up.: On the graph bends upward; after it bends downward.
- is decreasing and concave down.: The depth goes from to on this interval, so is increasing.
- is decreasing and concave up.: That describes , where the depth falls while the graph bends upward.
3. On the interval , how does the rate of change of behave?
- It is decreasing, because falls and then rises.
- It is negative throughout, because .
- It stays the same, because the graph is one smooth curve.
- It is increasing, so the graph of is concave up.
Show the answer
Concave up means the rate of change is increasing. Near the depth falls quickly, by it has stopped falling, and after that it rises faster and faster until .
- It is decreasing, because falls and then rises.: The direction of is a different question. Ask how the rate changes: it goes from strongly negative to positive.
- It is negative throughout, because .: On the depth rises, so the rate of change is positive there.
- It stays the same, because the graph is one smooth curve.: A smooth curve can bend; this one bends upward on .
- Correct: It is increasing, so the graph of is concave up.: Right: the depth drops fast near , then more slowly, then starts rising: the rate of change keeps increasing.
Table
A cooling cup of coffee
| (minutes) | 0 | 2 | 4 | 6 | 8 |
|---|---|---|---|---|---|
| (degrees Fahrenheit) | 180 | 158 | 141 | 128 | 119 |
4. What are the changes in over the four consecutive -minute intervals in the table?
- , , ,
- , , ,
- , , ,
- , , ,
Show the answer
, , , .
- Correct: , , , : Right: each is the later temperature minus the earlier one.
- , , , : These are the sizes of the drops. The temperature falls, so the changes are negative.
- , , , : These divide each change by minutes; the question asks for the changes in temperature.
- , , , : These are changes from , not over consecutive intervals.
5. Based on the table, which statement about on is true?
- is decreasing and its rate of change is decreasing.
- is increasing and its rate of change is decreasing.
- is decreasing and its rate of change is increasing.
- is decreasing at a constant rate.
Show the answer
falls, so it is decreasing. Over equal -minute steps the changes are , which increase, so the rate of change of is increasing and the graph of is concave up.
- is decreasing and its rate of change is decreasing.: The changes go up, so the rate of change is increasing.
- is increasing and its rate of change is decreasing.: Each temperature is lower than the one before, so is decreasing.
- Correct: is decreasing and its rate of change is increasing.: Right: the temperature falls, and the changes over equal intervals rise from to .
- is decreasing at a constant rate.: The changes over equal -minute intervals are not equal, so the rate is not constant.
6. A car starts from rest and speeds up steadily for seconds. Let be the distance it has traveled after seconds. Which describes the graph of on ?
- Increasing and concave down
- Increasing and concave up
- Decreasing and concave up
- Increasing with a constant rate of change
Show the answer
Distance traveled rises, so is increasing. Speeding up means the distance covered in each second grows: the rate of change of is increasing, so is concave up.
- Increasing and concave down: Concave down would mean the distance grows more slowly each second, as when a car slows down.
- Correct: Increasing and concave up: Right: the distance keeps growing, and it grows by more each second because the car speeds up.
- Decreasing and concave up: Distance traveled cannot go down while the car moves forward.
- Increasing with a constant rate of change: A constant rate would mean a constant speed; this car speeds up.
7. A taxi ride costs dollars for a trip of miles, and depends on . Which is the independent variable?
- , the number of miles
- , the cost
- The rate the taxi charges per mile
- The time of day
Show the answer
The independent variable is the input, the one that varies freely; the dependent variable is the output that depends on it. Here is a function of .
- Correct: , the number of miles: Right: you choose the miles, and the cost follows from them.
- , the cost: The cost depends on the miles, so is the dependent variable.
- The rate the taxi charges per mile: That is a fixed number in the rule, not a variable that changes.
- The time of day: Nothing in the description makes the cost depend on the time.
Part 9 · Summary
Summary
Part 10 · Up next
What comes next
Part 11 · Connections