Linear and quadratic functions are the first two members of a big family: polynomial functions. Their graphs can rise and fall several times and bend in both directions. This topic gives names to the points where that happens and shows how to find them from a graph, a table or a calculator.
Polynomial functions: degree and leading term
A polynomial function has the form
with whole-number powers and . The degree is , the highest power. The leading term is and the leading coefficient is . A nonzero constant, like , has degree .
The leading term is the term with the highest power, wherever it is written: in it is . For a product, multiply the highest-power parts of the factors: has leading term .
Local and global extrema
A local maximum of is an output that is at least as large as the outputs at all nearby inputs; a local minimum is one at most as large. Together they are local extrema. For a polynomial function, they happen where the function switches between increasing and decreasing.
When the domain is a closed interval, an endpoint can also be a local extremum. If falls as it leaves the left endpoint, the endpoint value is higher than its neighbors: a local maximum.
A global maximum is the greatest output over the whole domain, and a global minimum the least. On a closed interval, compare every local extremum value with both endpoint values.
Worked example 1. is defined for . Its graph falls to , rises to , falls to and rises to the end. Find the global maximum and minimum.
Candidates: local values , , ; endpoints
Global maximum (at the endpoint ); global minimum (at and ).
Two facts help you reason about extrema without a graph:
- Between two distinct real zeros of a polynomial function there is at least one local extremum: to leave the -axis and come back, the graph must turn.
- A polynomial function of even degree has a global maximum or a global minimum, because both ends of its graph go the same way. A quadratic's is at its vertex.
Points of inflection
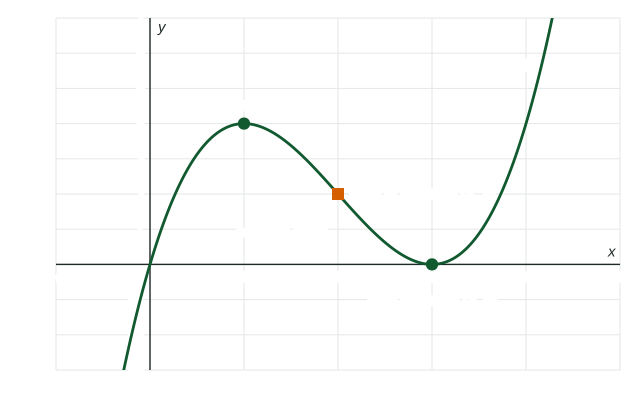
A point of inflection is where the graph changes concavity: from concave up to concave down, or back. In terms of rates, the rate of change switches from increasing to decreasing, or from decreasing to increasing. In the figure, is concave down left of and concave up right of it.
A table of rates over equal intervals shows the switch. If the rates on consecutive unit intervals are , they fall and then rise, so the graph changes from concave down to concave up around the interval .
Keep the two kinds of points apart. Extrema are where the direction changes; inflection points are where the bending changes.
Using a calculator
On the calculator part of the exam, use the graphing calculator's maximum and minimum features to locate extrema, and give answers accurate to three decimal places.
Worked example 2. A greenhouse's temperature is
Graph on and use the maximum feature: hours, degrees. Check the endpoints: and , both lower, so this is the global maximum.
Use the stored time. Evaluating at instead gives , which is not accurate to three decimal places.
Describe a stretch of the graph with direction and rate together: on , " is increasing and the rate of change of is decreasing", because the hourly gains shrink as the peak nears.