Topic 1.2 measured how fast a function changes with average rates of change. This topic asks how those rates behave for the two simplest families. Lines have one rate. Quadratics have rates that change at a steady pace. The difference shows up in tables, on graphs, and in the most-tested reasoning of the exam: estimating with a secant line and saying whether the estimate is too big or too small.
The secant line
A secant line is a line through two points of a graph. The secant line of through and has slope
which is exactly the average rate of change of on . Say it in one sentence: "The average rate of change of on is the slope of the secant line through and ." Graders look for that link.
Linear functions: one rate
For a linear function , every secant line is the line itself, so the average rate of change is on every interval. In a table at equal input steps, the first differences are all the same. For , each step of in changes by .
Quadratic functions: rates that change linearly
For a quadratic, take equal input steps and list the changes in output (the first differences). Then list the changes in those (the second differences). The second differences are constant.
Worked example 1. at .
| first differences | ||||||
| second differences |
Over steps of , each first difference is the average rate of change on that unit interval. The rates go up by each time: they change linearly. That is what "quadratic" means for rates of change.
The pattern also predicts: the next first difference is , so .
The steps must be equal. If a table jumps from to , its differences are not comparable with the others until you divide by the step length.
Concavity from the rates
When the average rates over consecutive equal intervals increase, the rate of change is increasing and the graph is concave up. When they decrease, it is concave down. The table above has rates : concave up. A ball's height has rates over the first four seconds: concave down.
For a quadratic , the concavity is the same everywhere: concave up when , concave down when .
Estimating with a secant line
An estimate from a secant line uses a point on the secant line, not on the graph. Then concavity tells you how good it is.
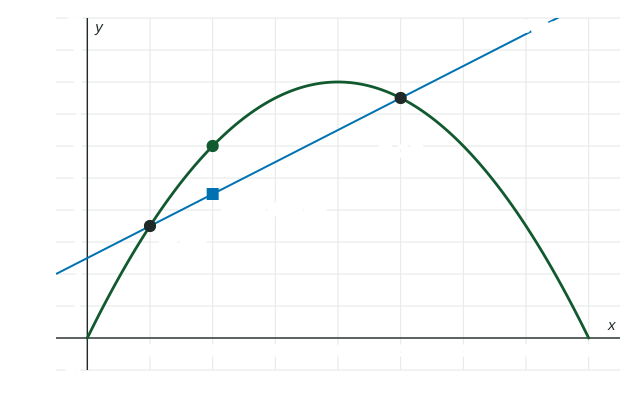
Worked example 2. For , use the secant line on to estimate , and say whether it is an overestimate or an underestimate.
, . Slope: . Secant line: .
Estimate: meters.
Reason: is concave down on , so its graph lies above the secant line between and . The estimate is an underestimate. (Check: .)
| On the interval, is | The graph is | A secant estimate is |
|---|---|---|
| concave up | below the secant line | an overestimate |
| concave down | above the secant line | an underestimate |
Whether is increasing or decreasing does not matter here; the concavity on the stated interval does. Name the interval in your reason: " is concave down on ".