Rates of Change in Linear and Quadratic Functions
A linear function has one rate of change.
Part 1 · Hook
Why this matters
Part 2 · Before you start
What this builds on
Part 3 · Prerequisite check
Quick check before you start
1. What is the average rate of change of on ?
Show the answer
.
- Correct: :
- :
- :
- :
2. What is the vertex of ?
Show the answer
Vertex form has vertex .
- Correct: :
- :
- :
- :
Part 4 · See it
See it first
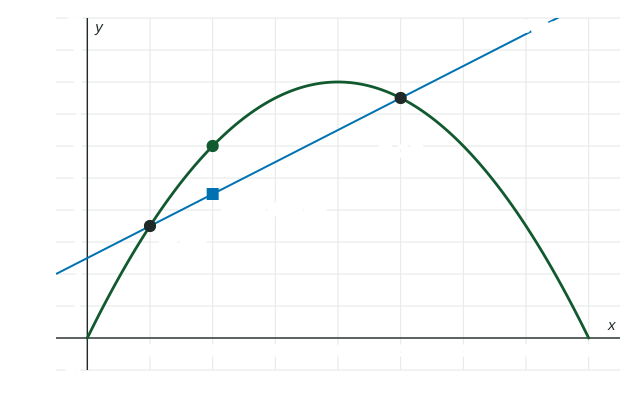
Part 5 · Step by step
How it works, step by step
- A function is linearits average rate of change is the same on every interval: the slope
- A function is quadratic and you take equal input stepsthe first differences change by a constant amount: the second differences are constant
- The average rates over consecutive equal intervals increase (or decrease)the graph is concave up (or concave down) there
- You estimate with a point on a secant line on an interval where is concave downthe graph lies above the secant line, so the estimate is an underestimate
Part 6 · Key ideas
Key ideas
- The secant line through and has slope , the average rate of change of on .
- Linear: constant rate of change. Quadratic: rates over consecutive equal intervals change linearly, so second differences are constant.
- Concave up: graph below the secant line, estimate too big. Concave down: graph above it, estimate too small.
Part 7 · Misconception
A common mistake
The wrong idea: A secant estimate is an overestimate whenever the function is increasing.
What actually happens: Over or under depends on concavity on the interval, not on direction. The ball's height rises on , but it is concave down on , so the secant estimate is below the true .
Part 8 · Check yourself
Check yourself
Exam-style questions. Anything you miss goes into your review queue.
Table
Values of with first and second differences
| 0 | 1 | 2 | 3 | 4 | 5 | |
|---|---|---|---|---|---|---|
| 4 | 3 | 6 | 13 | 24 | 39 | |
| Change in from the previous | -1 | 3 | 7 | 11 | 15 | |
| Change in that change | 4 | 4 | 4 | 4 |
1. Using the table, what is the average rate of change of on ?
No calculator. Type the exact value (a fraction, π, e or a root is fine).
Show the answer
- Answer: 5
2. The second differences in the table are all . What does that show about on ?
- The values fit a linear function, because the change in the change is the same at each step of the table.
- The values fit a quadratic: the rates on consecutive unit intervals rise by each step.
- is increasing on .
- The average rate of change of is on each interval of length .
Show the answer
Over steps of , the first differences are the average rates of change on . They change by the same amount, , each time: the rates change linearly, which is what a quadratic does.
- The values fit a linear function, because the change in the change is the same at each step of the table.: A linear function has constant first differences; these first differences, , are not constant.
- Correct: The values fit a quadratic: the rates on consecutive unit intervals rise by each step.: Right: constant second differences over equal steps are the mark of a quadratic.
- is increasing on .: , so decreases on .
- The average rate of change of is on each interval of length .: is the change in the rates, not a rate; the rates are .
3. Which statement about the graph of on is supported by the table?
- It is concave down, because the second differences are positive numbers that stay the same.
- It is concave up, because .
- It is concave up, because the average rates over consecutive equal intervals increase.
- It is a straight line, because the second differences are constant.
Show the answer
Over equal steps, increasing average rates of change mean the rate of change is increasing, so is concave up.
- It is concave down, because the second differences are positive numbers that stay the same.: Positive second differences mean the rates are going up, which is concave up.
- It is concave up, because .: Comparing two outputs gives direction, not concavity. Concavity comes from how the rates change.
- Correct: It is concave up, because the average rates over consecutive equal intervals increase.: Right: the rates increase.
- It is a straight line, because the second differences are constant.: A line has constant first differences; constant second differences mean a parabola.
Graph
Height of a ball
4. A ball's height is meters after seconds. What is the slope of the secant line through and ?
No calculator. Type the exact value (a fraction, π, e or a root is fine), in meters per second.
Show the answer
and . Slope meters per second, the average rate of change of on .
- Answer: 5 meters per second
5. A ball's height is meters after seconds. Use the secant line on to estimate . Is the estimate an overestimate or an underestimate?
- ; an overestimate, since is increasing on
- ; an underestimate, since is concave down on
- ; exact, since the point is on the graph of
- ; an underestimate, because the slope is positive
Show the answer
The estimate is a point on the secant line: . is concave down on (its rates fall), so its graph lies above the secant line between and , and is an underestimate. Indeed .
- ; an overestimate, since is increasing on : Whether rises does not decide over or under; the bending does. The graph is above the secant line.
- Correct: ; an underestimate, since is concave down on : Right: the secant line gives , and the true height is above it.
- ; exact, since the point is on the graph of : is itself; the secant line's value at is .
- ; an underestimate, because the slope is positive: is the slope. The estimate is the line's value at : .
6. A ball's height is meters after seconds. What happens to the average rates of change of on , , and ?
- They are : they decrease by each second.
- They are : they rise, then fall.
- They each equal , the slope of the secant line on .
- They are , which drop by from one to the next.
Show the answer
- Correct: They are : they decrease by each second.: Right: a quadratic's rates over consecutive equal intervals change by a constant amount.
- They are : they rise, then fall.: These are heights, not rates of change.
- They each equal , the slope of the secant line on .: Only a line has the same rate on every interval.
- They are , which drop by from one to the next.: : the rates drop by each step.
Part 9 · Summary
Summary
Part 10 · Up next
What comes next
Part 11 · Connections