
Choosing a model type is half the job. The other half is finding its constants, then using the model honestly: predicting with units, finding rates of change, and saying where the model stops making sense. This is the work of the exam's modeling question (Question 2), and it is where careful habits earn the most points.
Three ways to build a model
| You know | Build the model by | Example |
|---|---|---|
| As many data points as unknown constants | Substituting each point and solving the system | Three points give , , of a quadratic |
| A key feature, such as a vertex, and one more point | Transformations of a parent function | , then use a point to find |
| Many data points that do not fit exactly | Regression on the calculator | Quadratic regression on six data points |
Worked example 1 (a system). A garden center sold , and hundred plants in months , and . Find the quadratic model .
Substitute each point: , , .
Eliminate : the second minus the first gives ; the third minus the second gives .
Eliminate : subtract to get , so . Then gives , and gives .
The model is . Check : .
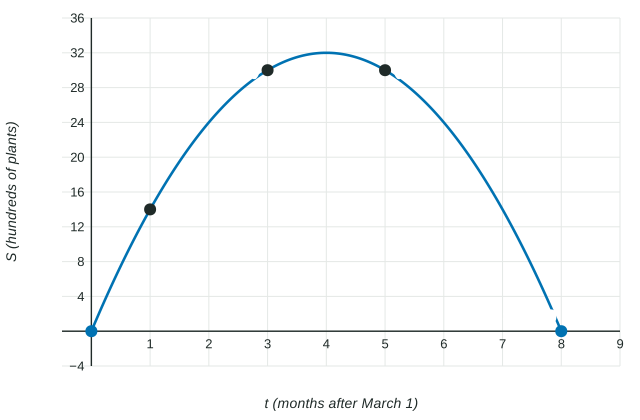
The same model comes from transformations. Its maximum is at , so ; the point gives and .
Regression: store every constant
Real data rarely fall exactly on a curve. A calculator regression (linear, quadratic, cubic or quartic in this unit) chooses the constants that bring the model closest to all the data at once. Enter the inputs and outputs as two lists, choose the regression type you justified from the data and context, and store the result.
Store, do not round. If , keep every digit in the calculator and use the stored model for every later step. Give only the final answer correct to three decimal places. Rounding a constant early and then predicting with it is the most common way to lose a point on Question 2.
Using the model: values, rates and units
A prediction is an output with its unit: hundred plants. An average rate of change is output units per input unit.
Worked example 2. Find the average rate of change of on and say what it means.
The average rate of change of on is
In context: from month to month , sales rose by hundred plants per month on average.
Inverse proportion and inverse-square laws
Some contexts call for a rational model. If is inversely proportional to , then : doubling halves , as when more painters share a job. An inverse-square law, , divides by when doubles, as for the brightness of a light and your distance from it.
Worked example 3. Intensity is inversely proportional to the square of the distance , and at . Find and .
, so and . Then and .
The domain the context allows
A model is only trusted for inputs the situation allows. For , the outputs are negative after , and sales cannot be negative, so the model can be used for (see the figure). Name the bound and the reason, with the values. Also say why predictions far past the last data point are risky: the data no longer support the model there, and its shape (here, falling toward negative values) may not match what really happens.