This topic puts everything in Unit 3 so far to work. A context describes something that repeats: a seat on a Ferris wheel, the depth of a harbor, the temperature in a greenhouse. You turn the description into a sinusoidal model, read it, and use it. This is exactly what the exam's periodic modeling question (no calculator) asks.
Step 1: five points on one cycle
A sinusoid passes through five landmark points in each cycle, a quarter period apart: an extreme, a midline crossing, the other extreme, the other midline crossing, and the first extreme again. Most periodic questions start by asking for their coordinates.
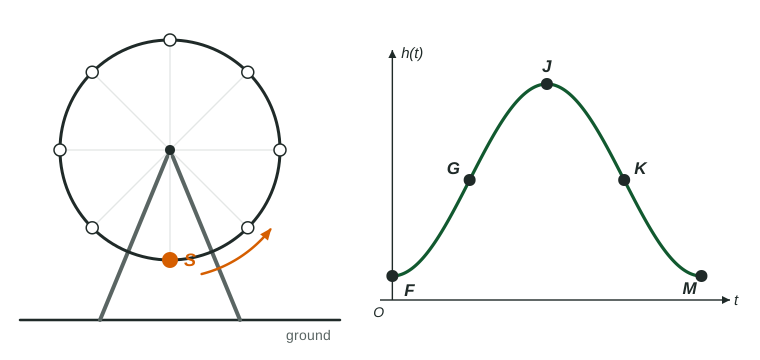
Worked example 1. A Ferris wheel has diameter 40 m and its center is 25 m above the ground. It turns once every 8 minutes. A seat is at its lowest point at . Give the coordinates of , , , and in the figure, where is the seat's height in meters.
The radius is 20 m, so the seat goes from m to m. The quarter period is minutes.
lowest, at the center's height going up, highest, going down, lowest again.
Step 2: the constants
From the five points: is the midline, the amplitude, . If the context gives a frequency, the period is its reciprocal first: 3 cycles per minute is a period of minute, so .
For the shift, match the starting point of the function you choose to a landmark:
| Landmark at | Simplest form |
|---|---|
| highest point | , |
| lowest point | , |
| midline, rising | , |
| midline, falling | , |
Worked example 2. Write the Ferris wheel model in the form
, , . The seat is at the midline and rising at , , so with :
Check at :
Step 3: how the quantity changes on an interval
Two separate questions, two separate answers:
- Is the quantity increasing or decreasing? Look at whether the graph is heading toward a highest point (increasing) or a lowest point (decreasing).
- Is its rate of change increasing or decreasing? Look at the concavity. Above the midline the graph is concave down, so the rate of change is decreasing; below it, concave up, rate increasing.
Worked example 3. For the seat, describe on .
From to the seat climbs, so is increasing. The graph is above the midline and bends down toward the top: concave down, so the rate of change of is decreasing. In words: the seat is rising, but more and more slowly as it nears the top.
Write both statements with the function's name and the interval. "Increasing at a decreasing rate" is calculus wording that the precalculus rubric does not ask for: say " is increasing and the rate of change of is decreasing."
Models from data
When you have data instead of a description, read the greatest and least values and the cycle length from a table, exactly as above. With a graphing calculator you can also run a sinusoidal regression, which chooses all four constants to fit the data as closely as possible. In radian mode, store the constants rather than rounding them, and give final answers correct to three decimal places.
Worked example 4 (calculator). A greenhouse's temperature is modeled by
Graph and on in radian mode and find the intersections: and . Between them the temperature is above 25, for hours. Use the stored values when you subtract.
Where the model holds
A sinusoidal model repeats forever, but the world does not have to. Tides drift because the real cycle is not exactly the one in the model; temperatures change with the seasons and the weather. Use a model on the domain the context supports, and expect predictions far beyond the data to get worse.