Sinusoidal Function Context and Data Modeling
To model a periodic context, get the midline and amplitude from the greatest and least values, the period (and b = 2π/period ) from the cycle length or frequency, and the shift from one landmark time.
Part 1 · Hook
Why this matters
Part 2 · Before you start
What this builds on
Part 3 · Prerequisite check
Quick check before you start
1. A sinusoid has period 12. In
Show the answer
- Correct: :
- :
- :
- :
2. A student runs a regression on a graphing calculator. What does the regression do?
- Finds the constants of the chosen model type that fit the data most closely
- Finds the exact formula the data came from
- Draws the line through the first and last data points
- Rounds each data value to three decimal places
Show the answer
A regression chooses the constants of a model type you pick (linear, quadratic, exponential and so on) so the model is as close as possible to the data.
- Correct: Finds the constants of the chosen model type that fit the data most closely:
- Finds the exact formula the data came from:
- Draws the line through the first and last data points:
- Rounds each data value to three decimal places:
Part 4 · See it
See it first
Part 5 · Step by step
How it works, step by step
- The context gives the greatest and least valuesthe midline and the amplitude
- The context gives the time for one cycle, or the frequencythe period ( if needed), then
- The context gives one landmark: when the quantity is highest, lowest, or at its midline and risingchoose sine or cosine and the sign of to match that landmark, then set so the landmark lands at the right time
- The model is used to predictit is trustworthy only on the domain the context supports; with data, a sinusoidal regression on a calculator builds the same kind of model
Part 6 · Key ideas
Key ideas
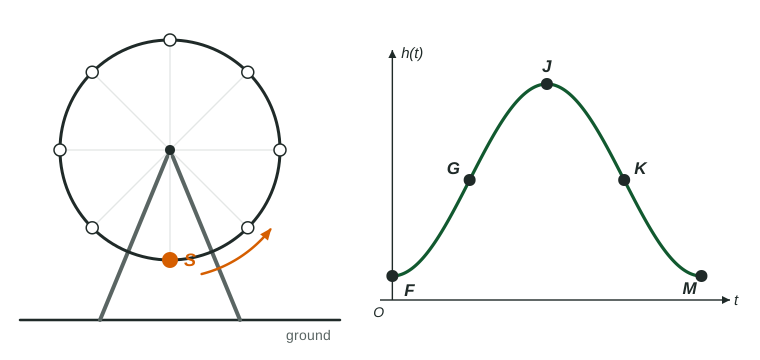
- Five labeled points on one cycle are: a highest or lowest point, a midline crossing, the opposite extreme, the other midline crossing and the first extreme again, each a quarter period apart.
- Easy landmarks: highest at gives with ; lowest at gives the same with ; midline and rising at gives with .
- Describe change on an interval in two separate statements: whether the quantity is increasing or decreasing, and whether its rate of change is increasing or decreasing (concave up or concave down).
- A model fits the facts it was built from. Past the data, or if the real cycle drifts, predictions get worse.
Part 7 · Misconception
A common mistake
The wrong idea: If a tide goes from high to low in 6 hours, the period is 6 hours.
What actually happens: High to low is half a cycle. The water must come back up to high tide to finish a cycle, so the period is 12 hours and .
Part 8 · Check yourself
Check yourself
Exam-style questions. Anything you miss goes into your review queue.
Graph
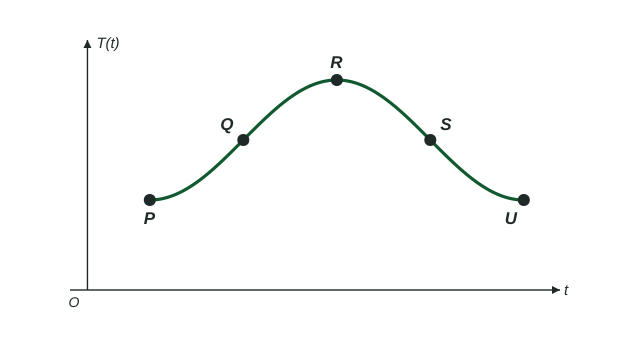
Temperature in a greenhouse
1. What are the coordinates of ?
Show the answer
is the highest point: C at .
- Correct: : Time first, then temperature: 4 p.m. is .
- : 20 is the midline temperature; is the highest point.
- : The greatest temperature is at 4 p.m., which is , not noon.
- : The coordinates are reversed: the input comes first.
2. What are the coordinates of ?
Show the answer
The period is 24 hours (lowest at 4 and again at 28), so landmarks are 6 hours apart. is 6 hours after , on the midline : .
- Correct: : A quarter period after the highest point, at the midline height.
- : The coordinates are reversed.
- : 12 is the least temperature; is on the midline.
- : This uses 3 hours as the quarter period; the period is 24 hours, so a quarter is 6.
3. Write a formula for .
Type an expression for .
Show the answer
, , period 24 so . Lowest at : a cosine with shifted right 4.
- Answer:
4. Which statement describes on the interval ?
- is decreasing, and the rate of change of is decreasing
- is decreasing, and the rate of change of is increasing
- is increasing, and the rate of change of is decreasing
- is decreasing, and the rate of change of is constant
Show the answer
From to the temperature falls from its peak toward the midline, so is decreasing. The graph is above the midline, concave down, so the rate of change of is decreasing: it starts at 0 at the peak and becomes more and more negative.
- Correct: is decreasing, and the rate of change of is decreasing: Falling, and concave down above the midline.
- is decreasing, and the rate of change of is increasing: The rate of change is increasing only where the graph is concave up, below the midline, as on .
- is increasing, and the rate of change of is decreasing: After the highest point at the temperature falls.
- is decreasing, and the rate of change of is constant: A sinusoid's rate of change is never constant on an interval; here it keeps decreasing.
5. What is the average rate of change of on , in degrees Celsius per hour?
No calculator. Type the exact value (a fraction, π, e or a root is fine), in degrees Celsius per hour.
Show the answer
and :
- Answer: ≈ 1.333 degrees Celsius per hour
6. A weight on a spring bobs up and down with a frequency of 4 cycles per second. Its height is modeled by , in seconds, with . What is ?
No calculator. Type the exact value (a fraction, π, e or a root is fine).
Show the answer
Period second, so .
- Answer: ≈ 25.133
7. The height of a swing seat is feet, in seconds. Which describes on the interval ?
- is decreasing, and the rate of change of is decreasing
- is decreasing, and the rate of change of is increasing
- is increasing, and the rate of change of is decreasing
- is increasing, and the rate of change of is increasing
Show the answer
The period is . The highest point is at () and the midline crossing at (). On the height falls while the graph is above the midline, concave down, so the rate of change of is decreasing.
- Correct: is decreasing, and the rate of change of is decreasing: Falling from the top toward the midline, concave down.
- is decreasing, and the rate of change of is increasing: The rate of change increases only below the midline, on here.
- is increasing, and the rate of change of is decreasing: That describes , before the highest point.
- is increasing, and the rate of change of is increasing: That describes , rising from the lowest point.
Part 9 · Summary
Summary
Part 10 · Up next
What comes next
Part 11 · Connections