The graphs of sine and cosine are only the beginning. Stretch them taller, squeeze them sideways, lift them up, slide them along, and you get a whole family of waves that model tides, temperatures, sound and anything else that rises and falls smoothly and evenly. This page names the family and the four numbers that describe each member.
What makes a function sinusoidal
A sinusoidal function (a sinusoid) is any function whose graph is the graph of after vertical and horizontal dilations and translations, the transformations you met in Unit 1. The shape stays the same smooth wave: equal highest points, equal lowest points, evenly spaced, with the same rounded turns. The cosine graph is a sinusoid too: it is the sine graph translated to the left.
Not every periodic function is sinusoidal. The tank whose depth climbs in straight lines and holds steady at the top is periodic but not sinusoidal: its graph has corners and flat stretches.
Midline and amplitude
A sinusoid oscillates around a horizontal line, its midline, halfway between its greatest and least values:
midline: .
The amplitude is how far the wave reaches from the midline, up or down. It is half the distance from the least value to the greatest:
amplitude .
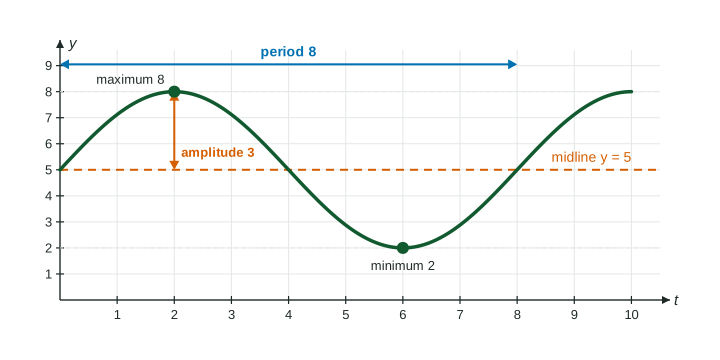
Worked example 1. The water depth at a pier goes between 2.2 meters and 3.8 meters in a smooth wave. Find the midline and the amplitude.
Midline: . Amplitude: meters.
Check: and . Midline plus or minus the amplitude gives the greatest and least values.
For a formula like , the factor stretches the heights of (between and ) to between and , and lifts everything by . So the amplitude is and the midline is . For example, goes from to , with amplitude 4 and midline .
Period and frequency
The period is the length of one cycle along the input axis, measured between any two matching points: highest to highest, or midline crossing going up to the next one going up. The frequency is how many cycles fit in one unit of input:
frequency , period .
Worked example 2. A guitar string vibrates 220 times per second. What is the period of its motion?
The frequency is 220 cycles per second, so the period is second, about 0.0045 second.
Worked example 3. A table gives a buoy's height at seconds: meters, and the pattern repeats. Find the period and frequency, and the height at .
The heights return to the same value going the same way after 8 seconds (3 m and rising at and at ). Note also gives 3 m, but there the buoy is falling, so that is only half a cycle. Period 8 seconds; frequency cycle per second.
, so the height at equals the height at : 3.8 m.
Period and frequency are easy to mix up in context. Ask which one is a time (the period, in seconds per cycle) and which one is a count (the frequency, in cycles per second).
Sine is odd, cosine is even
The point at angle is the reflection across the -axis of the point at : same -coordinate, opposite -coordinate. So
and .
Sine is an odd function: its graph is symmetric about the origin. Cosine is an even function: its graph is symmetric about the vertical axis. For example, while .
Summary of the four features
| Feature | How to find it | For |
|---|---|---|
| Midline | ||
| Amplitude | ||
| Period | length of one full cycle | |
| Frequency |
The next topic shows how each number appears in a formula,