Carrying Out a Test for the Difference Between Two Population Means
A two-sample t test computes t = (x-bar_1 − x-bar_2)/(√(s_1²/n_1 + s_2²/n_2)) , finds the p-value from the t distribution with technology or conservative df in the direction of H_a , and concludes about μ_1 − μ_2 in context.
Part 1 · Hook
Why this matters
Part 2 · Before you start
What this builds on
Part 3 · Prerequisite check
Quick check before you start
1. For a two-sample t test, the null hypothesis is usually
Show the answer
No difference in the true means, written with parameters.
- Correct: :
: - :
- :
2. The standard error of is
Show the answer
Each variance over its own , added, then the square root.
- Correct: :
- :
- :
- :
Part 4 · See it
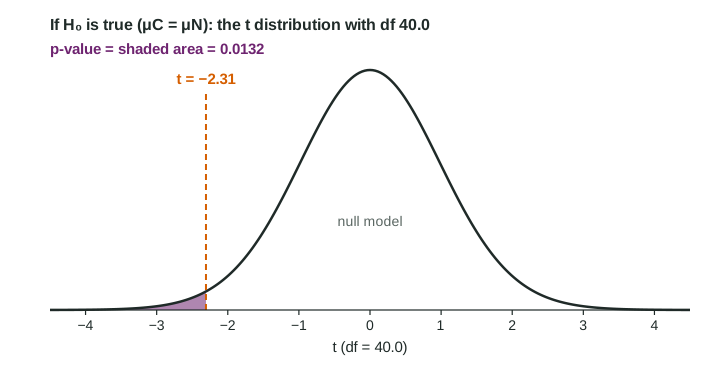
See it first
Part 5 · Step by step
How it works, step by step
- Assume : the true means are equal, differences in sample means vary around 0 with standard error
- Measure the observed difference in standard errors
- Find the tail area in the direction of with technology df, or the conservative df (smaller ), which gives a slightly larger p-value
- Compare with and conclude in contextthen say what the design allows: cause and effect (random assignment) or generalizing (random sampling)
Part 6 · Key ideas
Key ideas
- Two-sample t statistic:
. - p-value: left tail for , right tail for , twice the smaller tail for ; technology df, or the conservative df (also accepted).
- Conclusion: "Because the p-value of 0.0132 is less than 0.05, we reject . There is convincing evidence that the true mean ... with caffeine is less than without ..."
- Choosing the procedure: proportion or mean? one sample, paired, or two independent groups? interval or test?
Part 7 · Misconception
A common mistake
The wrong idea: A p-value of 0.274 shows the two counties have the same mean exercise time.
What actually happens: A large p-value means the observed difference is the kind chance alone often produces. It is not convincing evidence of a difference, and it is not evidence that the means are equal.
Part 8 · Check yourself
Check yourself
Exam-style questions. Anything you miss goes into your review queue.
Table
Caffeine and reaction time
Forty-two adult volunteers were randomly assigned to drink a caffeinated drink (C, 20 people) or an identical-tasting caffeine-free drink (N, 22 people). Thirty minutes later each did a reaction-time task (invented data). Dotplots of both groups show no strong skew or outliers. The researchers test against at , where and are the true mean reaction times with and without caffeine for adults like these.
| Group | n | Mean | SD |
|---|---|---|---|
| Caffeine (C) | 20 | 241 | 28 |
| No caffeine (N) | 22 | 262 | 31 |
1. Write the expression for the test statistic. Type it as on the exam, for example (a - b)/sqrt(s^2/m + r^2/n).
Type the expression as on the exam, with the values substituted.
Show the answer
- Answer:
2. What is the p-value of the test?
Type a number. A table answer and a calculator answer are both accepted.
Show the answer
with technology df 40.0 gives
- Answer: 0.0132
3. State the conclusion at ().
Write the conclusion in context.
Show the answer
p is below alpha: reject and state the evidence for about the difference in true means, in context.
- A full-credit answer: Because the p-value of 0.0132 is less than 0.05, we reject the null hypothesis. There is convincing evidence that the true mean reaction time with caffeine is less than without caffeine, for adults like these.
4. What does the design let the researchers conclude?
- Caffeine causes faster mean reaction time for adults like these volunteers
- Caffeine speeds reactions for each adult in the population
- Just an association, because the sample sizes are under 30
- Nothing, because the groups have different sizes
Show the answer
Random assignment: cause and effect. Random sampling (absent): generalizing to a population.
- Correct: Caffeine causes faster mean reaction time for adults like these volunteers: Random assignment supports cause and effect. The volunteers were not a random sample, so the result applies to adults like them.
- Caffeine speeds reactions for each adult in the population: Volunteers were not randomly sampled from a population, and a test is about means, not every adult.
- Just an association, because the sample sizes are under 30: Sample size affects conditions, not whether cause and effect can be claimed.
- Nothing, because the groups have different sizes: Unequal group sizes are fine for a two-sample t test.
5. A teacher measures each of 28 students' quiz scores before and after a review game and asks whether scores rise on average. Which procedure fits?
- A two-sample t test comparing before and after scores
- A paired t test on the 28 differences
- A two-proportion z test
- A one-sample t test on the after scores alone
Show the answer
Same individuals measured twice: paired t test, , with = after minus before.
- A two-sample t test comparing before and after scores: The two sets of scores come from the same students, so they are not independent.
- Correct: A paired t test on the 28 differences: Each student gives two linked scores, so test the mean of the after minus before differences.
- A two-proportion z test: Scores are quantitative; the parameter is a mean difference.
- A one-sample t test on the after scores alone: The before scores carry the comparison.
6. A researcher compares the proportion of adults who exercise at least 3 hours a week in two counties, using independent random samples. Which procedure fits?
- A two-sample t test for
- A paired t test
- A two-sample z test for
- A one-sample t test for each county
Show the answer
Choosing the procedure: categorical response, two groups, so a two-sample z test for proportions. Quantitative response, two independent groups: two-sample t test.
- A two-sample t test for : The question is about a proportion, not a mean number of hours.
- A paired t test: The two samples are independent, and the response is categorical.
- Correct: A two-sample z test for : The response is "at least 3 hours or not", a categorical variable, so compare proportions.
- A one-sample t test for each county: Two separate tests do not compare the counties.
Part 9 · Summary
Summary
Part 10 · Up next
What comes next
Part 11 · Connections