Constructing a Confidence Interval for the Difference Between Two Population Proportions
To estimate p_1 − p_2 , use the two-sample z interval (p-hat_1 − p-hat_2) ±z*√((p-hat_1(1 − p-hat_1))/(n_1) + (p-hat_2(1 − p-hat_2))/(n_2)) after checking random, 10% and large counts for each sample.
Part 1 · Hook
Why this matters
Part 2 · Before you start
What this builds on
Part 3 · Prerequisite check
Quick check before you start
1. What critical value goes with 95% confidence?
Show the answer
95% in the middle leaves 2.5% in each tail; .
- Correct: :
- :
- :
- :
2. For independent samples, the standard deviation of is found by
- adding the two variances, then taking the square root
- subtracting the two standard deviations
- adding the two standard deviations
- averaging the two standard deviations
Show the answer
Variances add for independent samples.
- Correct: adding the two variances, then taking the square root:
- subtracting the two standard deviations:
- adding the two standard deviations:
- averaging the two standard deviations:
Part 4 · See it
See it first
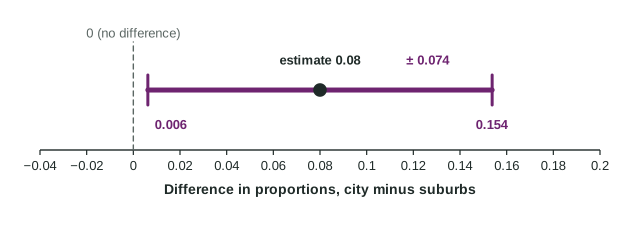
Part 5 · Step by step
How it works, step by step
- You want the true difference but only have two samplesthe sample difference is the point estimate
- Sample differences vary with standard deviation replace each by its to get the standard error, since the s are unknown
- The sampling distribution is approximately normal when the four counts reach 10go standard errors each way:
- The method captures the true difference in about 95% of samplessay "we are 95% confident that the interval captures the true difference in proportions", naming the order of subtraction
Part 6 · Key ideas
Key ideas
- Two-sample z interval:
. - Conditions: two independent random samples or two randomly assigned groups; each sample under 10% of its population; at least 10 successes and 10 failures in each sample.
- Interpret: "We are 95% confident that the interval from ... to ... captures the true difference in the proportions of ... (group 1 minus group 2)."
- Random assignment allows a cause-and-effect conclusion; random sampling allows generalizing to the populations.
Part 7 · Misconception
A common mistake
The wrong idea: A 95% interval for means 95% of the people in group 1 are that much more likely to say yes.
What actually happens: The interval estimates one number, the true difference in the two population proportions. It says nothing about individuals; the 95% describes how often the method captures that number.
Part 8 · Check yourself
Check yourself
Exam-style questions. Anything you miss goes into your review queue.
Table
App use at city and rural stores
| Stores | Use the app | Sample size | Sample proportion |
|---|---|---|---|
| City | 180 | 300 | 0.60 |
| Rural | 99 | 220 | 0.45 |
1. What is the point estimate of , the difference between the true proportions of city and rural shoppers who use the app?
Show the answer
The point estimate is .
- : That is the proportion for both samples together, . It mixes the groups instead of comparing them.
- : That averages the two sample proportions. The estimate of a difference is a difference.
- : That subtracts the counts, . The samples have different sizes, so compare proportions, not counts.
- Correct: : Right:
.
2. Which statement correctly checks the large counts condition for a confidence interval for ?
- The counts 180, 120, 99 and 121 are each at least 10
- and are each at least 10
- Each sample proportion is between 0.1 and 0.9
- The two sample sizes, 300 and 220, are each at least 30
Show the answer
An interval uses and : , , , are each at least 10.
- Correct: The counts 180, 120, 99 and 121 are each at least 10: Right: for an interval, use the observed successes and failures in each sample: and .
- and are each at least 10: There is no reason to use 0.5. An interval uses each sample's own .
- Each sample proportion is between 0.1 and 0.9: That is not the condition. The counts of successes and failures must each reach 10.
- The two sample sizes, 300 and 220, are each at least 30: Comparing with 30 is not the check for proportions. Count successes and failures in each sample.
3. What is the standard error of ? Give three decimal places.
Type a number. A table answer and a calculator answer are both accepted.
Show the answer
- Answer: 0.044
4. Construct a 95% confidence interval for . Give each end to three decimal places.
Type the interval as "from a to b".
Show the answer
- Answer: from 0.064 to 0.236
5. Interpret the 95% interval from 0.064 to 0.236 in context.
Write the conclusion in context.
Show the answer
Name the level, the interval and the parameter in context: the true difference, city minus rural.
- A full-credit answer: We are 95% confident that the interval from 0.064 to 0.236 captures the true difference in the proportions of all city shoppers and all rural shoppers who use the app (city minus rural).
6. A researcher takes independent random samples of 400 nurses and 350 teachers and asks whether each works a second job. She wants to estimate how much the true proportions differ. Which procedure fits?
- Two one-sample z intervals, checked for overlap
- A two-sample z interval for
- A one-proportion z test of
- A one-sample z interval for , using the 750 people combined
Show the answer
Estimate a difference of two proportions with a two-sample z interval.
- Two one-sample z intervals, checked for overlap: Overlap of two intervals is a rough and misleading comparison. One interval for the difference answers the question directly.
- Correct: A two-sample z interval for : Right: two independent random samples, a categorical variable, and an estimate of a difference.
- A one-proportion z test of : Nothing here is about 0.5, and the goal is to estimate, not to test one proportion.
- A one-sample z interval for , using the 750 people combined: Combining the samples estimates one overall proportion. The question compares two groups.
7. Independent random samples give with and with . What is the margin of error of a 95% confidence interval for ? Give three decimal places.
Type a number. A table answer and a calculator answer are both accepted.
Show the answer
- Answer: 0.062
Part 9 · Summary
Summary
Part 10 · Up next
What comes next
Part 11 · Connections