
Intelligence is the ability to learn from experience, solve problems and use what you know to handle new situations. Psychologists have argued for more than a century about whether it is one ability or many, how to measure it, and what the scores mean. This topic puts the statistics from the research skills chapter to work: the normal curve, z scores, percentiles, correlation and significance.
One ability or many?
People who score well on one kind of mental test (vocabulary, say) tend to score well on others (math, puzzles, memory). Charles Spearman noticed these positive correlations and proposed general intelligence, or g: a broad ability behind many tasks. g predicts school grades and job performance moderately well, and it is the basis of most intelligence tests.
Others argue for multiple abilities: separate strengths, such as musical, social or practical skill, that a single score misses. The idea is popular and reminds us that people have different strengths, but evidence that these are truly independent intelligences is limited; most of them correlate with g. The exam asks you to contrast the two views, not to name their authors.
Measuring it: from mental age to the normal curve
Early tests compared a child's performance with what typical children of each age could do, giving a mental age. The original intelligence quotient (IQ) was
Worked example: a ratio IQ. An 8-year-old performs like a typical 10-year-old.
Step 1: mental age over chronological age: .
Step 2: times 100: .
The ratio breaks down for adults (a 40-year-old does not have twice the "mental age" of a 20-year-old), so modern tests do it differently.
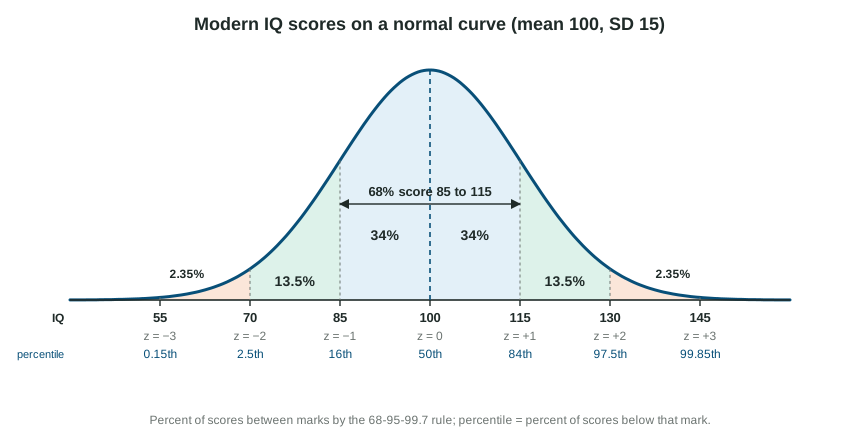
Modern tests are standardized: given the same way to everyone and scored against norms from a large, representative sample of people the same age. Scores are set so they form a normal curve with a mean of 100 and a standard deviation of 15. So an IQ of 115 is one standard deviation above the mean (), about the 84th percentile, and 68% of people score between 85 and 115.
Worked example: reading an IQ score. A score of 130.
Step 1: z score: .
Step 2: by the 68-95-99.7 rule, 95% of scores are between 70 and 130, so 5% are outside, half of them above: 2.5% score above 130.
Step 3: percentile: 97.5% score below 130, about the 98th percentile.
Is it a good test? Reliability and validity
| Reliability | Validity | |
|---|---|---|
| Question | Are the scores consistent? | Does it measure (or predict) what it should? |
| Kinds | test-retest: the same people score similarly a month later; split-half: the two halves of the test agree | construct: it measures the intended trait; predictive: scores predict a later outcome such as grades |
| Checked with | a correlation of the test with itself | a correlation with another measure or outcome |
A test can be reliable without being valid (a bathroom scale that is always 5 pounds off is consistent but wrong), but it cannot be valid without being reliable.
Scores in context
Stereotype threat is a drop in performance when people fear confirming a negative stereotype about their group. In early experiments (Steele & Aronson, 1995), Black students did worse on a hard verbal test when it was described as a test of ability. Later, larger studies and reviews suggest the effect is real in some situations but smaller and less consistent than the first studies showed, and some well-designed replications found little or none. Stereotype lift is the reverse: a small boost from being compared with a group stereotyped as worse.
The Flynn effect: average raw scores on intelligence tests rose by about 3 points per decade across much of the 20th century, so tests had to be renormed. That is far too fast to be genetic and points to better nutrition, health and schooling. In some countries the rise has recently stalled or reversed.
Within-group and between-group variation. Twin and adoption studies usually estimate the heritability of intelligence test scores at about 0.5 or somewhat higher in adults (lower in childhood), mostly from samples in wealthier countries; heritability describes differences within a group, never one person. Plant seeds from one bag in rich soil and in poor soil. Within each field, height differences are mostly genetic; the difference between the fields is all soil. In the same way, a trait can be strongly heritable within groups while a gap between groups' averages comes from the environment. Group averages also hide huge overlap: most of the variation is within groups, not between them.
A history of misuse. Intelligence tests have been used to justify discrimination. In the early 1900s, tests given in English to newly arrived immigrants, and US Army tests given to recruits in 1917 that assumed American cultural knowledge, produced low scores that were cited in arguments for restricting immigration from southern and eastern Europe. Test scores were also cited to support forced sterilization laws and to place children in lower school tracks by race or class. These are reasons modern tests are checked for bias and why a score is one piece of information, not a verdict on a person.
Achievement, aptitude and mindset
An achievement test measures what you have already learned (a chemistry final). An aptitude test is designed to predict what you can learn or how you will perform (a test used for admission to a training program). In practice the two overlap, since past learning predicts future learning.
A growth mindset is the belief that ability can grow with effort and good strategies; a fixed mindset treats ability as set. Students with a growth mindset tend to persist after setbacks. Large studies of short mindset lessons find the average effect on grades is small, with bigger benefits for students who were struggling. Effort still needs a good strategy, such as the retrieval and spaced practice from the memory topics.