
Developmental psychology studies how people change, and how they stay the same, from conception to old age. The exam asks two kinds of questions about it: which big theme a situation shows, and what a study's design can and cannot tell you. This page covers both.
Three themes behind every question
Almost every debate in development comes back to three questions.
| Theme | The question | What it looks like |
|---|---|---|
| Nature and nurture | How much comes from heredity, and how much from experience? | Identical twins raised apart have similar heights, but the one with better food grows taller. Genes set a range; the environment moves the person within it. |
| Continuity and discontinuity | Is change gradual, or does it come in distinct steps? | Vocabulary grows a little every month (a ramp: continuous). Stage theories say thinking changes in qualitatively different steps (a staircase: discontinuous). |
| Stability and change | Does a trait stay steady in a person over time? | The class clown at 16 is still the funniest person in the room at 40 (stability). A shy toddler becomes an outgoing teen (change). |
Modern research rarely picks one side. Nature and nurture interact; some abilities grow smoothly while others shift quickly; and traits such as temperament show moderate stability, with plenty of room for change. When an item asks which theme a scenario shows, ask what the speaker is claiming: a cause (nature and nurture), a shape of change (continuity), or sameness in one person over time (stability).
Two designs for studying age
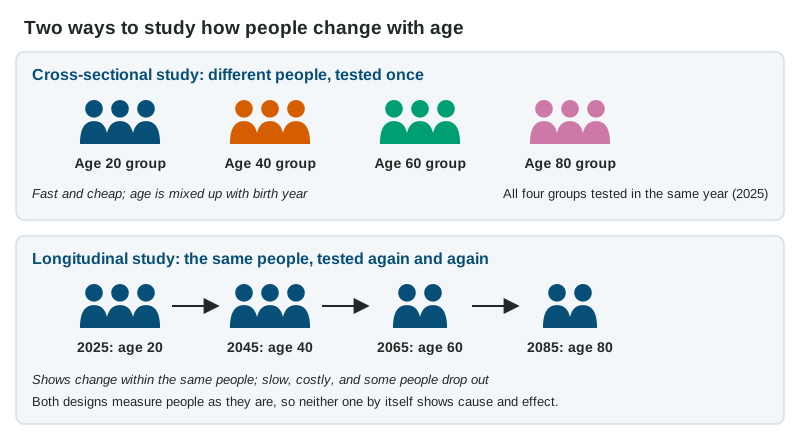
A cross-sectional study compares people of different ages at the same time: test 20-, 40-, 60- and 80-year-olds this year. It is fast and cheap. Its weakness is that each age group is also a different birth cohort. People born around 1950 went to different schools, had different health care and grew up without smartphones. A difference between the groups can be a cohort effect, caused by the times people grew up in rather than by aging.
A longitudinal study follows the same people and tests them again and again, perhaps at 20, 40, 60 and 80. Because each person is compared with their own earlier self, it shows real change within individuals and avoids cohort effects between age groups. Its costs: it takes years or decades, it is expensive, and people drop out. Dropout (attrition) is rarely random. If the people who leave are sicker or less able, the people left at the end make the group look better than it really is.
| Cross-sectional | Longitudinal | |
|---|---|---|
| Who is tested | different people of different ages | the same people, repeatedly |
| When | once | over years |
| Main strength | quick and cheap | shows change within each person |
| Main weakness | cohort effects | slow, costly, people drop out |
Why the two designs can disagree
Classic research on adult intelligence shows how this plays out. Cross-sectional studies in the mid-1900s found that older adults scored much lower than younger adults, which suggested a steady decline from early adulthood. Long-running longitudinal studies, which followed the same adults and also compared cohorts, found that many abilities, especially vocabulary and knowledge, hold steady or even rise into the 50s and 60s, with clearer declines later. Much of the early "decline" was a cohort effect: younger generations had more years of schooling.
Worked example: reading the gap. An invented cross-sectional study finds mean verbal scores of 54 at age 25 and 41 at age 70. A longitudinal study of one group finds 50 at 25 and 48 at 70.
Cross-sectional difference: points. Longitudinal difference: points.
What it shows: comparing different generations makes the drop look 11 points larger than following the same people. A cohort effect is the most likely reason: the 70-year-olds grew up in a different time. The longitudinal drop may itself be a little too small if less healthy people dropped out.
What these designs can and cannot prove
Age cannot be randomly assigned. Nobody can be made 70. So both designs measure people as they are, and both are kinds of non-experimental research. They describe and predict, but neither, by itself, shows that age causes a change. When a longitudinal study finds that shy toddlers tend to be quieter teens, the link is a correlation. A third variable, such as a family that rarely meets new people, could produce both. The exam rewards saying exactly that: name the design, then say why it does not support a cause.
Studies of children also carry their own ethics. Because minors cannot legally consent, parents or guardians give informed consent, and children old enough to understand give their own informed assent. An IRB reviews the plan, and data are kept confidential, often by replacing names with code numbers.