Intelligence and Achievement
Intelligence tests measure a general ability (g) that shows up across many tasks, though some theories stress separate abilities.
Part 1 · Hook
Why this matters
Part 2 · Before you start
What this builds on
Part 3 · Prerequisite check
Quick check before you start
1. On a normal curve, about what percent of scores fall within one standard deviation of the mean?
- 68%
- 95%
- 50%
- 34%
Show the answer
By the 68-95-99.7 rule, 68% of scores lie within one standard deviation of the mean.
- Correct: 68%:
- 95%:
- 50%:
- 34%:
2. What does "statistically significant" mean?
- The result is unlikely to be due to chance alone
- The result is large and important
- The result will always replicate
- The sample was random
Show the answer
Significance means a result would be unlikely if only chance were at work. It does not say how big the effect is.
- Correct: The result is unlikely to be due to chance alone:
- The result is large and important:
- The result will always replicate:
- The sample was random:
3. What does a correlation of r = .90 between two sets of scores show?
- A strong positive relationship
- A weak relationship
- A strong negative relationship
- That one causes the other
Show the answer
An r close to +1 is a strong positive relationship. Correlation alone does not show cause.
- Correct: A strong positive relationship:
- A weak relationship:
- A strong negative relationship:
- That one causes the other:
Part 4 · See it
See it first
Part 5 · Step by step
How it works, step by step
- Scores on very different mental tests correlatemany researchers propose a general intelligence, g
- A test is standardized on a representative samplescores can be placed on a normal curve and read as percentiles
- A test is reliable and validits scores are consistent and predict what they should
- Tests are given in biased ways or used to rank groupsscores are misread, as in the history of testing immigrants and the misuse of group differences
Part 6 · Key ideas
Key ideas
- General intelligence (g) explains why different tests correlate; multiple-ability views stress separate strengths.
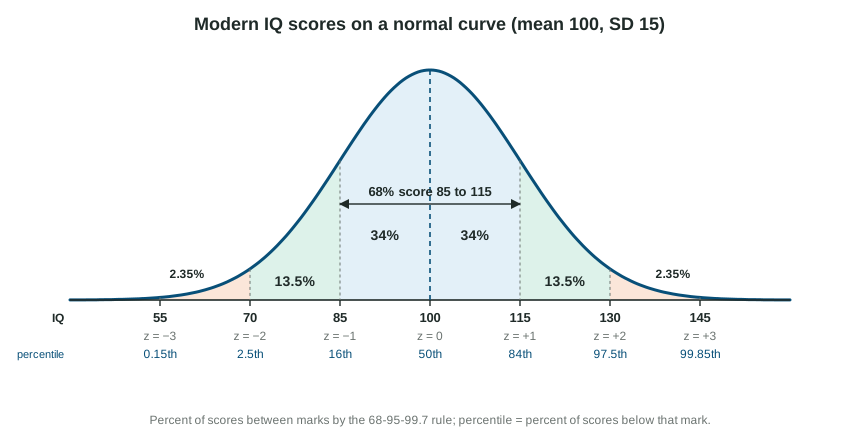
- The original IQ was . Modern tests are standardized: a normal curve, mean 100, SD 15.
- A good test is reliable (test-retest, split-half: consistent) and valid (construct, predictive: measures what it should).
- Scores are shaped by context: stereotype threat and lift, the Flynn effect, and the fact that within-group differences do not explain between-group gaps. Tests have been misused against immigrants and minority groups.
- Achievement tests measure what you learned; aptitude tests predict what you can learn. A growth mindset sees ability as developable; a fixed mindset does not.
Part 7 · Misconception
A common mistake
The wrong idea: If a trait is highly heritable within groups, then a difference between groups must be genetic too.
What actually happens: Within-group heritability says nothing about the cause of a gap between groups. Seeds from one bag grow taller in rich soil than in poor soil, though height within each field is mostly genetic.
Part 8 · Check yourself
Check yourself
Exam-style questions. Anything you miss goes into your review queue.
Data
IQ scores on a normal curve with marked percentiles
A modern intelligence test is standardized so that scores in the norm group form a normal curve with a mean of 100 and a standard deviation of 15. Marked percentiles: 70 is about the 2nd percentile, 85 the 16th, 100 the 50th, 115 the 84th and 130 about the 98th. The region above 130 is shaded.
1. Malia scores 130 on this test. What is her z score?
Type a number. No calculator needed: work it out by hand, as on the exam.
Show the answer
- Answer: 2
2. By the 68-95-99.7 rule, what percent of people score between 85 and 115?
Type a number (%). No calculator needed: work it out by hand, as on the exam.
Show the answer
85 and 115 are one standard deviation below and above the mean: .
- Answer: 68 %
3. By the 68-95-99.7 rule, what percent of people score above 130 (the shaded region)?
Type a number (%). No calculator needed: work it out by hand, as on the exam.
Show the answer
Between 70 and 130 (two standard deviations each side) lie 95% of scores. The other 5% are split evenly between the two tails, so score above 130.
- Answer: 2.5 %
4. Jonah's score is at the 84th percentile. What does that mean?
- He scored higher than about 84% of the norm group
- He answered about 84% of the test items correctly
- His IQ score is 84 points on this test
- He scored lower than about 84% of the norm group
Show the answer
A percentile rank is the percent of scores below a given score. The 84th percentile is one standard deviation above the mean, an IQ of 115.
- Correct: He scored higher than about 84% of the norm group: Right: A percentile rank is the percent of scores below a given score. The 84th percentile is one standard deviation above the mean, an IQ of 115.
- He answered about 84% of the test items correctly: A percentile compares a score with other people's scores; it is not the percent of items answered correctly.
- His IQ score is 84 points on this test: An IQ of 84 is about one standard deviation below the mean, near the 16th percentile.
- He scored lower than about 84% of the norm group: That reverses it. The 84th percentile means 84% scored below him.
5. On an early intelligence test, a child aged 8 performs like a typical 10-year-old. Using the original IQ formula (mental age divided by chronological age, times 100), what is the child's IQ?
Type a number. No calculator needed: work it out by hand, as on the exam.
Show the answer
.
- Answer: 125
6. A college admissions test is given to applicants, and their scores correlate r = .45 with their first-year college grades. What property of the test does this correlation measure?
- Test-retest reliability
- Standardization
- Split-half reliability
- Predictive validity
Show the answer
Validity is whether a test measures or predicts what it is supposed to. A correlation between test scores and later grades measures predictive validity.
- Test-retest reliability: Test-retest reliability compares the test with itself on two occasions, not with grades.
- Standardization: Standardization is giving the test the same way and comparing to a norm group, not linking scores to grades.
- Split-half reliability: Split-half reliability compares the two halves of the same test.
- Correct: Predictive validity: Right: Validity is whether a test measures or predicts what it is supposed to. A correlation between test scores and later grades measures predictive validity.
Part 9 · Summary
Summary
Part 10 · Up next
What comes next
Part 11 · Connections