
Two groups in a study never score exactly the same, even when the treatment does nothing. People differ, and chance decides who lands in which group. So every result raises a question: is this difference real, or just luck? This page explains how psychologists answer it, and why "significant" does not mean "big".
From a sample to a population
Descriptive statistics summarize the people in a study: their mean, median and spread. But researchers want to know about people in general. Inferential statistics use the sample to draw conclusions about the population, with a stated chance of being wrong. The exam does not ask you to run these tests; it asks you to read what their results mean.
Statistical significance
Suppose students who slept 8 hours recalled 3 more words, on average, than students who slept 5 hours. Inferential statistics ask: if sleep made no difference at all, how often would chance alone produce a gap this large? That probability is the p value. By convention, if it is under 5%, written , the result is called statistically significant: unlikely to be due to chance alone.
"Not statistically significant" means the opposite: a difference this large could plausibly come from chance, so the study cannot claim a real difference. It does not prove there is no difference. A small study might simply be too small to tell.
Worked example: reading a statistic for the groups.
"Students randomly assigned to walk for 10 minutes before a test rated their worry at 4.8 out of 10; students who sat quietly rated it 5.6. The difference was statistically significant ()."
Misses the point: "Statistical significance means the results are unlikely to be due to chance." A definition, not applied to these groups.
Misses the point: "The walking group had a mean of 4.8 and the sitting group 5.6." Restates the numbers without saying what they show.
Earns the point: "The walking group reported less worry than the sitting group, by 0.8 points, and because the difference was significant it is unlikely to be due to chance alone."
Effect size: how big is it?
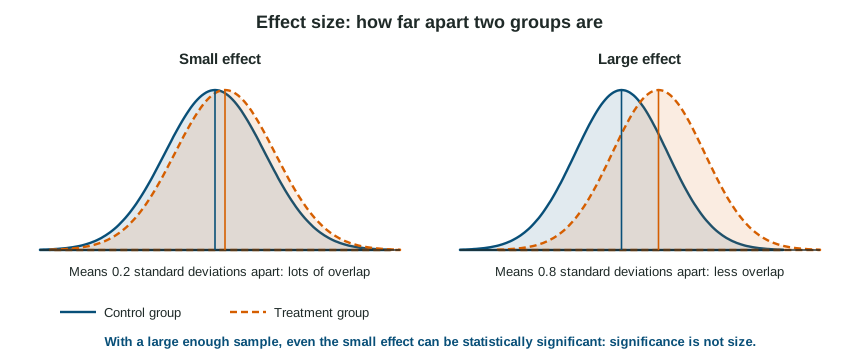
Significance answers "is it chance?". Effect size answers "how big is it?". A common effect size measures how many standard deviations apart two group means are. Researchers often call about 0.2 standard deviations small, 0.5 medium and 0.8 large, though what counts as important depends on the question.
Why report both? Because significance depends on sample size. With 20,000 participants, even a 0.5-point difference on a 100-point test is unlikely to be chance, so it is significant, yet it is too small to matter to anyone. With 40 participants, a 15-point difference can fail to reach significance, because small groups bounce around a lot by chance.
| Statistical significance | Effect size | |
|---|---|---|
| Question | Could chance alone explain it? | How large is it? |
| Depends on sample size? | yes: bigger samples find smaller differences significant | no |
| A common misreading | "significant" taken to mean "important" | a small effect taken to mean "not real" |
Effect sizes also matter for replication. Combining many studies in a meta-analysis gives a better estimate of an effect's true size, and several famous findings turned out to be much smaller than their first studies suggested.