Many chance questions have the same shape: repeat a yes-or-no trial a set number of times and count the yeses. How many of 10 customers use an app? How many of 12 guessed answers are right? How many of 20 parts are defective? These counts all follow one distribution, the binomial, with one formula.
The binomial setting
A count of successes is binomial when the chance process is a binomial setting. Check four conditions, in context:
- Binary: each trial has two outcomes, success or failure (uses the app or not).
- Independent: the outcome of one trial does not change the chances on another (customers chosen at random do not influence each other).
- Number: the number of trials, n, is fixed in advance (10 customers).
- Same probability: the probability of success, p, is the same on every trial (0.3 for each customer).
The first letters spell BINS. When a condition fails, the count is not binomial. Draw 4 tickets without replacement from a jar of 12 with 4 winners, and the chance of a winner changes after every draw: 4 of 12, then 3 of 11 or 4 of 11. The draws are not independent, and p is not constant.
Where the formula comes from
Let X = the number of the 10 customers who use the app. Think about . One particular order, 4 app users then 6 non-users, has probability by the multiplication rule for independent trials. Every other order of 4 users and 6 non-users has the same probability. How many orders are there? That is the number of ways to choose which 4 of the 10 customers are users, , from the counting skills page. So
This is the binomial probability formula on the reference sheet. The two exponents always add to n: k successes and failures.
Worked example 1. A polling firm dials 15 random numbers; 20% of calls are answered. Let Y = the number of answered calls. Find .
Name it: Y is binomial with and .
Structure and substitution:
Answer: . A calculator's binomial probability command gives the same value; on the exam, write the distribution, the parameters and the expression, not just the command.
More than one value: add, or use the complement
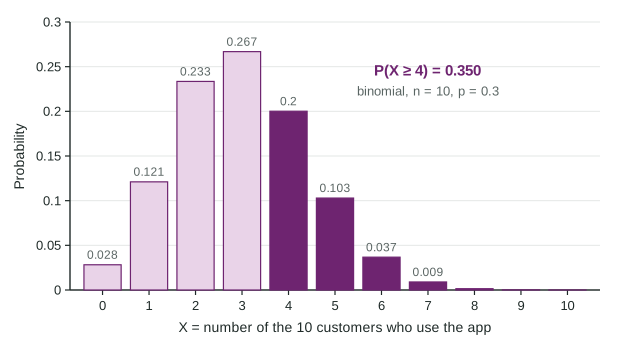
Most questions ask about several values. First write the event as an inequality. "Fewer than 2" is . "At least 4" is . Then add the probabilities, or use a cumulative probability and the complement.
Worked example 2. For the coffee shop, find the probability that at least 4 of the 10 customers use the app.
X is binomial with , . The boundary is 4 and the direction is "4 or more".
This is the shaded area in the figure.
The classic slip is . The opposite of "4 or more" is "3 or fewer", so the complement stops at 3.
Mean and standard deviation
For a binomial random variable, the mean and standard deviation have short formulas, both on the reference sheet:
For the guessing quiz (, ): questions and
Using a binomial probability to judge a claim
The shop claims 30% of customers use the app, and 7 of 10 random customers did. Assume the claim and compute the chance of a result at least that extreme:
Conclusion: if 30% of customers use the app, the probability that 7 or more of 10 randomly chosen customers use it is about 0.011. Because that is so unlikely, the sample gives reason to doubt the claim and suggests more than 30% use the app.
Compare a coin that lands heads 7 times in 10 flips. If it is fair,
| Words | Write | Compute |
|---|---|---|
| exactly 3 | the formula | |
| at most 3 | cumulative | |
| fewer than 3 | cumulative | |
| at least 4 |