A two-way table holds a lot of counts. Turning them into shares is what lets you answer questions. The trick is that the same count, 45, can be part of three different shares, depending on which total you divide by. This page names the three and shows how to tell which one a question wants.
One table, three totals
Rangers at a state park asked a random sample of 250 visitors two questions: is this your first visit, and what is your main activity today?
| Visit type | Hiking | Fishing | Picnic | Total |
|---|---|---|---|---|
| First visit | 45 | 15 | 40 | 100 |
| Returning | 60 | 54 | 36 | 150 |
| Total | 105 | 69 | 76 | 250 |
Every share is a count over a total. The table has three kinds of total: the grand total (250), the row totals (100 and 150) and the column totals (105, 69, 76). Each kind gives its own name.
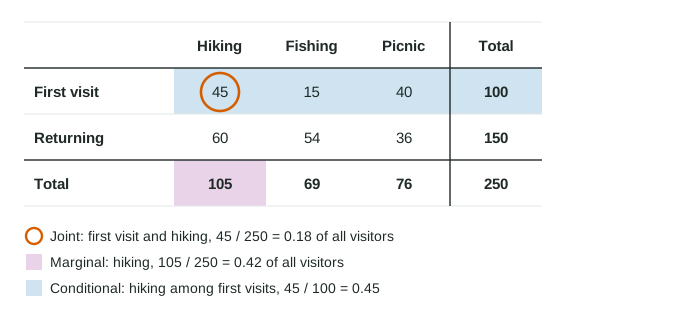
Joint, marginal and conditional
- A joint relative frequency is one cell over the grand total. : 18% of all visitors were on a first visit and hiking.
- A marginal relative frequency is a row or column total over the grand total. : 42% of all visitors hiked. The marginal totals sit in the margins of the table, hence the name. Listing it for every activity (42%, 27.6%, 30.4%) gives the marginal distribution of activity.
- A conditional relative frequency is one cell over its row or column total. : of the first-time visitors, 45% hiked. Listing it for every activity gives the conditional distribution of activity for first-time visitors.
| Kind | Divide | Answers | Example |
|---|---|---|---|
| Joint | a cell by the grand total | "What share of everyone is both ...?" | |
| Marginal | a total by the grand total | "What share of everyone is ...?" | |
| Conditional | a cell by its group's total | "Of those who ..., what share ...?" |
Finding the group
Conditional questions are where most mistakes happen. Read the question for the group it starts from. That group's total goes on the bottom.
Worked example 1. Find (a) the proportion of returning visitors who came to fish and (b) the proportion of people who fished who were returning visitors.
(a) The group is returning visitors, 150 of them. 54 fished: .
(b) The group is the people who fished, 69 of them. 54 were returning: .
Same cell, 54, but different groups, so different answers. Mixing these two up is the most common slip with two-way tables.
Comparing groups
To compare first-time and returning visitors, compare their conditional distributions:
| Visit type | Hiking | Fishing | Picnic |
|---|---|---|---|
| First visit (100) | 45% | 15% | 40% |
| Returning (150) | 40% | 36% | 24% |
Each row adds to 100%. The rows differ, most of all for fishing, so visit type and activity are associated in this sample.
Worked example 2. A ranger claims that returning visitors are more likely to come to fish. Use the data to respond.
Compare conditional relative frequencies: for returning visitors and for first visits.
The data support the claim for this sample: 36% of returning visitors (54 of 150) came to fish, compared with 15% of first-time visitors (15 of 100). Because the visitors were a random sample, the comparison can be generalized to the park's visitors.
What no association looks like
If visit type made no difference, each row would match the marginal distribution: 42% hiking, 27.6% fishing, 30.4% picnic for both groups. That gives a quick check. Overall 63% of new drivers in a sample passed their road test on the first try. If driver's education were not associated with passing, about 63% of the course takers and about 63% of the others would pass. When the conditional relative frequencies are far from each other, as 75% and 55% are, the variables are associated.
One more fact follows. A marginal relative frequency is a weighted mix of the conditional ones. If 30% of men and 30% of women prefer a window seat, then 30% of everyone does, whatever the numbers of men and women.