Carrying Out a Test for a Population Mean or Population Mean Difference
Carry out a one-sample (or paired) t test by computing t = (x-bar − μ_0)/(s/√n) with n − 1 df, finding the p-value in the direction of H_a , and comparing it with α .
Part 1 · Hook
Why this matters
Part 2 · Before you start
What this builds on
Part 3 · Prerequisite check
Quick check before you start
1. For and , a p-value of 0.03 at means
- reject : there is convincing evidence that
- accept :
- fail to reject
- there is a 3% chance that is true
Show the answer
, so reject ; the evidence supports .
- Correct: reject : there is convincing evidence that :
- accept : :
- fail to reject :
- there is a 3% chance that is true:
2. A standardized test statistic has the form
- (statistic minus null value) divided by the standard error
- statistic divided by the sample size
- null value minus statistic
- standard error divided by the statistic
Show the answer
It counts how many standard errors the statistic is from the null value.
- Correct: (statistic minus null value) divided by the standard error:
- statistic divided by the sample size:
- null value minus statistic:
- standard error divided by the statistic:
3. For paired data, the hypotheses , are tested with
- a one-sample t test on the differences
- two separate one-sample tests
- a one-proportion z test
- a z test using
Show the answer
A paired t test is a one-sample t test on the differences.
- Correct: a one-sample t test on the differences:
- two separate one-sample tests:
- a one-proportion z test:
- a z test using :
Part 4 · See it
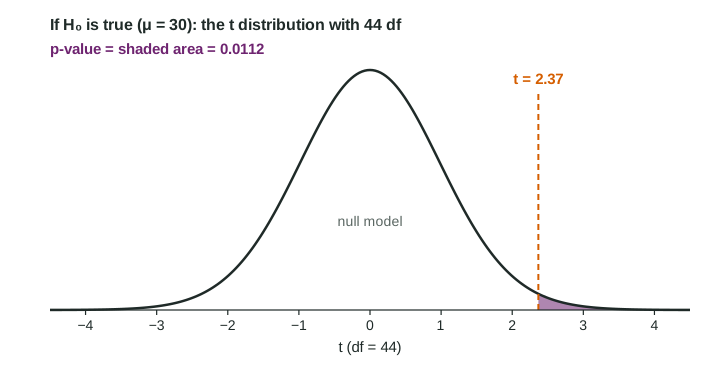
See it first
Part 5 · Step by step
How it works, step by step
- Assume is true: the true mean is sample means vary around with standard error
- Measure the gap in standard errors, with
- Find the area beyond in the direction of that area is the p-value (double the tail for )
- Compare the p-value with reject if , fail to reject otherwise, and state the evidence for in context
Part 6 · Key ideas
Key ideas
- t statistic: (paired:
), . - p-value: right tail for , left tail for , twice the smaller tail for . Table B brackets it; technology gives it exactly.
- Conclusion: "Because the p-value of 0.0112 is less than 0.05, we reject . There is convincing evidence that the true mean ... is greater than ..."
- A large p-value is "not convincing evidence", never "accept " or "the mean is ".
Part 7 · Misconception
A common mistake
The wrong idea: A p-value of 0.0112 means there is a 1.12% chance that the null hypothesis is true.
What actually happens: The p-value is computed assuming is true. It is the probability of a sample mean at least as extreme as the one observed, by chance alone, when the true mean is .
Part 8 · Check yourself
Check yourself
Exam-style questions. Anything you miss goes into your review queue.
Table
Testing the delivery time claim
A company advertises a mean delivery time of 30 minutes in one city. A manager suspects the true mean is longer and takes a random sample of 45 of last month's thousands of deliveries (invented data). She tests against , where is the true mean delivery time of all the company's deliveries in the city, at .
| Sample size | Sample mean | Sample standard deviation |
|---|---|---|
| 45 | 32.4 minutes | 6.8 minutes |
1. Write the expression for the test statistic. Type it as on the exam, for example (a - b)/(s/sqrt(n)).
Type the expression as on the exam, with the values substituted.
Show the answer
- Answer:
2. What is the p-value of the test?
Type a number. A table answer and a calculator answer are both accepted.
Show the answer
With and , the p-value is the area to the right: . Technology: a one-sample t test gives , . Table B (df 40 row) puts it between 0.01 and 0.02.
- Answer: 0.0112
3. State the conclusion of the test at .
Write the conclusion in context.
Show the answer
Compare the p-value with alpha, then state the evidence for in context, naming the parameter.
- A full-credit answer: Because the p-value of 0.0112 is less than 0.05, we reject the null hypothesis. There is convincing evidence that the true mean delivery time of all the company's deliveries in the city is greater than 30 minutes.
4. Interpret the p-value of 0.0112 in context.
Write the conclusion in context.
Show the answer
A p-value is a probability computed assuming the null hypothesis is true: the chance of a sample result at least as extreme as the one observed, in the direction of .
- A full-credit answer: Assuming the true mean delivery time of all the company's deliveries in the city is 30 minutes, there is a 0.0112 probability of getting a sample mean of 32.4 minutes or more by chance in a random sample of 45 deliveries.
5. For the sleep study (, , ), state the conclusion at .
Write the conclusion in context.
Show the answer
0.080 is greater than 0.05, so fail to reject . The data are not convincing evidence of a difference, which is not the same as showing the mean is 8.
- A full-credit answer: Because the p-value of 0.080 is greater than 0.05, we fail to reject the null hypothesis. There is not convincing evidence that the true mean nightly sleep of students at the university is different from 8 hours.
6. A t test gives at . Which statement is correct?
- The data do not give convincing evidence against the null hypothesis
- The data show that the null hypothesis is true
- There is a 27% chance that the null hypothesis is true
- The sample mean equals the hypothesized mean
Show the answer
: fail to reject . That is "not convincing evidence", never "accept ".
- Correct: The data do not give convincing evidence against the null hypothesis: A large p-value means results like these are common when is true, so there is not convincing evidence for .
- The data show that the null hypothesis is true: Failing to reject is not proof of ; the true mean could differ by an amount this sample could not detect.
- There is a 27% chance that the null hypothesis is true: A p-value is computed assuming is true; it is not the probability of .
- The sample mean equals the hypothesized mean: The sample mean almost surely differs from ; the difference is just not convincing.
Part 9 · Summary
Summary
Part 10 · Up next
What comes next
Part 11 · Connections