Constructing a Confidence Interval for the Difference Between Two Population Means
To estimate μ_1 − μ_2 from two independent samples or randomized groups, use (x-bar_1 − x-bar_2) ±t*√((s_1²)/(n_1) + (s_2²)/(n_2)) with technology df or the conservative df.
Part 1 · Hook
Why this matters
Part 2 · Before you start
What this builds on
Part 3 · Prerequisite check
Quick check before you start
1. For independent samples, the standard deviation of is
Show the answer
Variances add, then take the square root.
- Correct: :
- :
- :
- :
2. A one-sample t interval for a mean is
- with df
Show the answer
Statistic plus or minus times the standard error .
- Correct: with df:
- :
- :
- :
Part 4 · See it
See it first
Part 5 · Step by step
How it works, step by step
- The parameter is , the difference in true meansits point estimate is
- Replace and with and the standard error is
- Estimating two standard deviations adds uncertaintyuse , with technology df (Welch) or the conservative df, the smaller of and
- Check random, 10% and normal/large sample for each groupbuild
and interpret it in context, order of subtraction stated
Part 6 · Key ideas
Key ideas
- Two-sample t interval:
. - Degrees of freedom: technology (Welch) gives a non-integer df; the conservative df is the smaller of and , which gives a slightly wider interval. Both are accepted.
- Conditions for each group: random (two independent random samples or random assignment), 10% (when sampling), normal/large sample.
- Two independent groups use this interval; two linked measurements on each unit are paired and use a one-sample t interval on the differences.
Part 7 · Misconception
A common mistake
The wrong idea: Build a t interval for each group; if they overlap, there is no difference.
What actually happens: Two separate intervals answer a different question and can overlap even when the difference is clear. Estimate the difference directly with one two-sample t interval for .
Part 8 · Check yourself
Check yourself
Exam-style questions. Anything you miss goes into your review queue.
Graph
Spaced versus massed practice
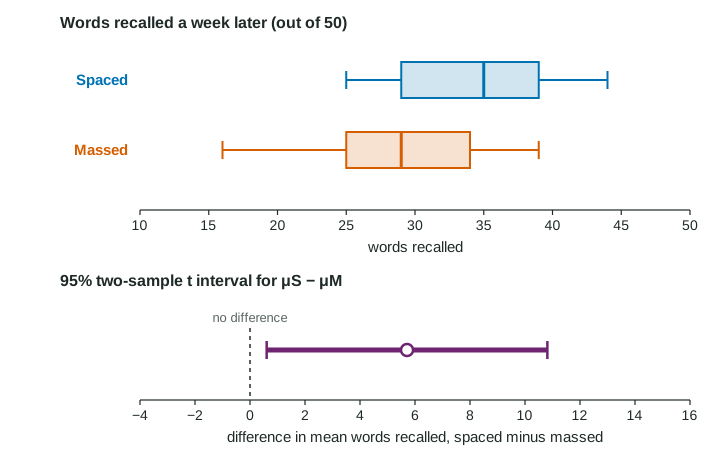
Twenty-eight student volunteers learned 50 new vocabulary words. They were randomly assigned, 14 to each group, to study in four short sessions spread over a week (spaced) or in one long session (massed). A week later each took the same recall test (invented data).
| Group | n | Mean | SD |
|---|---|---|---|
| Spaced | 14 | 34.21 | 6.13 |
| Massed | 14 | 28.50 | 6.97 |
1. Which procedure estimates how much better spaced practice is, on average?
- A paired t interval for the mean difference
- A two-sample z interval for
- Two one-sample t intervals, one per group
- A two-sample t interval for
Show the answer
Parameter: , the true mean recall with spaced practice minus with massed practice, for volunteers like these. Procedure: a two-sample t interval.
- A paired t interval for the mean difference: The volunteers were not paired: each was in one group only, so there are no natural pairs to subtract.
- A two-sample z interval for : Words recalled is quantitative, so the parameter is a difference of means.
- Two one-sample t intervals, one per group: Two separate intervals do not estimate the difference, and overlapping intervals are hard to judge.
- Correct: A two-sample t interval for : Two separate groups from random assignment, a quantitative response and unknown population standard deviations: a two-sample t interval for the difference in true mean recall.
2. Each group has only 14 students. How is the normal/large sample condition met?
- The two groups together have 28 students
- Neither boxplot shows strong skew or outliers
- The volunteers were randomly assigned to the two groups
- 14 is less than 10% of the students at their school
Show the answer
Conditions: random assignment (random); no 10% check for an experiment; normal/large sample from the two boxplots, each without strong skew or outliers.
- The two groups together have 28 students: Each group is checked on its own, and 14 is less than 30.
- Correct: Neither boxplot shows strong skew or outliers: With in both groups, each group's graph must show no strong skew and no outliers. Both boxplots are roughly symmetric with no outliers.
- The volunteers were randomly assigned to the two groups: That is the random condition. Shape is a separate check.
- 14 is less than 10% of the students at their school: The 10% condition does not apply to random assignment, and it is about independence, not shape.
3. How many degrees of freedom does technology give for the two-sample t interval? (The conservative choice is also accepted.)
Type a number. A table answer and a calculator answer are both accepted.
Show the answer
Technology uses the Welch formula and gives . The conservative choice is the smaller : . Either is accepted on the exam. Reading Table B, use the row at or below the technology df (25), never a rounded-up row.
- Answer: 25.58
4. Construct the 95% confidence interval for , in words recalled.
Type the interval as "from a to b".
Show the answer
- Answer: from 0.61 to 10.81
5. Interpret the 95% interval from 0.61 to 10.81 words in context.
Write the conclusion in context.
Show the answer
Name the level, the interval, the parameter (a difference of true means, in the order spaced minus massed) and the context.
- A full-credit answer: We are 95% confident that the interval from 0.61 to 10.81 words captures the true difference in mean recall (spaced minus massed) for volunteers like these.
6. A two-sample t interval uses samples of and . What are the conservative degrees of freedom?
Type a number. A table answer and a calculator answer are both accepted.
Show the answer
Conservative degrees of freedom: the smaller of and , so 17. Technology would give a larger, non-integer df.
- Answer: 17
7. Which study calls for a two-sample t interval rather than a paired t interval?
- Battery life of 30 phones of brand A and 30 phones of brand B, chosen at random
- Blood pressure of 30 patients measured before and after taking a new medicine for a month
- Tread wear on the left and right front tires of 30 cars
- Scores of 30 sets of twins, one twin per teaching method
Show the answer
Two-sample procedures need two independent groups. Paired procedures are for two linked measurements on each unit.
- Correct: Battery life of 30 phones of brand A and 30 phones of brand B, chosen at random: Two separate random samples with no link between a phone of brand A and a phone of brand B.
- Blood pressure of 30 patients measured before and after taking a new medicine for a month: Each patient gives two linked values: paired.
- Tread wear on the left and right front tires of 30 cars: Left and right tires on the same car are a natural pair.
- Scores of 30 sets of twins, one twin per teaching method: Twins are matched pairs.
Part 9 · Summary
Summary
Part 10 · Up next
What comes next
Part 11 · Connections