How much energy does the world use, where does it come from, and who uses it? These questions come up on the exam as graphs and tables, so this page teaches the patterns and how to read them with numbers.
The world runs mostly on fossil fuels
About 80 percent of the world's energy comes from oil, coal and natural gas (80 to 86 percent, depending on how a source counts renewables; IEA and Energy Institute, 2023 to 2025). Oil is the largest single source, and most of it is refined into gasoline, diesel and jet fuel for transportation. Coal is the largest single source of electricity worldwide. Natural gas heats buildings, generates electricity and runs factories. The rest comes from moving water, nuclear power, wind, sunlight and biomass. Wind and solar are the fastest-growing sources, but they started from a small base.
Who uses the most energy
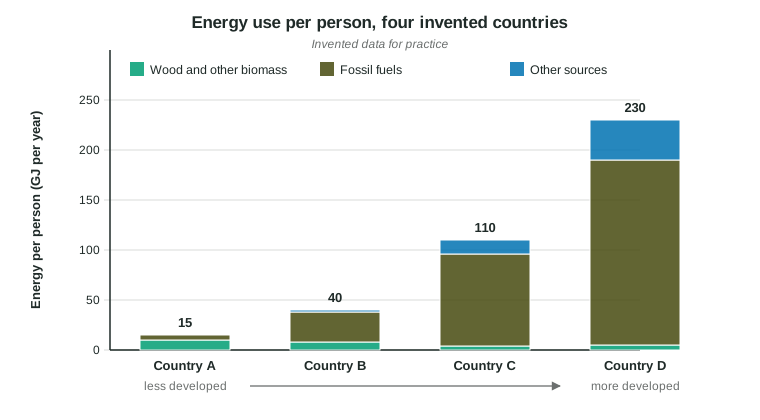
Energy consumption per person follows wealth. A developed country has factories, cars, appliances, air conditioning and heating, and each runs on fuel or electricity. The United States has about 4 percent of the world's people but uses roughly one sixth of the world's energy, so each American uses about four times the world average.
In developing countries, use per person is much lower. About 2.1 billion people lack clean cooking fuels (2023); most of them burn wood, charcoal, crop waste or dried dung, often over open fires, because these fuels are cheap or free to gather. As these countries industrialize, their energy use climbs. China passed the United States as the largest total energy user in the late 2000s, although its use per person is still lower.
Total use and use per person
Two numbers describe a country's energy use, and the exam often asks you to tell them apart:
- Total use: all the energy a country uses in a year, in units such as petajoules (PJ), exajoules (EJ) or quads.
- Use per person: the total divided by the population, often in gigajoules (GJ) per person.
Total use = population × use per person. A country can have a huge total because it has many people, or because each person uses a lot. World use keeps rising because both factors are growing in developing countries.
Use per person. A country uses 3,000 PJ a year and has 25 million people. 1 PJ = 1,000,000 GJ.
Setup:
Answer: . Write the scale word as a number: 25 million = 25,000,000.
Reading trends with percent change
When a graph shows energy use over time, describe the trend with numbers and compare with percent change: (new - old) / old × 100.
Percent change. Natural gas use rose from 50 EJ in 1980 to 140 EJ in 2020.
Setup: . The brackets (the fraction bar) show the subtraction comes first.
Answer: . Natural gas use nearly tripled.
A source can grow by a large amount but a small percent, or the other way round. Between 2000 and 2020 in the invented data on this page, coal grew by 55 EJ (about 58 percent) and renewables by 40 EJ (about 133 percent). Say which one you mean.
What drives the trends
| Factor | Effect on energy use |
|---|---|
| Population growth | raises total use |
| Industrialization and rising income | raises use per person (factories, vehicles, appliances) |
| Cold or very hot climate | raises use per person (heating or cooling) |
| More efficient machines and buildings | lowers use per person for the same services |
| Price and availability of fuels | decides which fuels are used |
When you describe a trend, give the direction and the numbers: "coal use rose from 95 EJ in 2000 to 150 EJ in 2020." A claim without the data does not earn the point.