If you lined up everyone in a country by age, from babies to the oldest, and stacked them in bars, you would get a picture that predicts the country's future. An age structure diagram, also called a population pyramid, is that picture. Its shape tells you whether a population will grow, hold steady or shrink, and what a country will need in the decades ahead.
Reading a population pyramid
- Each horizontal bar is a cohort: the people born in one span of years, such as ages 0 to 9.
- Males are on the left, females on the right. Bar length is the number of people, or the percent of the population.
- The youngest cohorts are at the bottom and the oldest at the top. As years pass, each cohort moves up one level.
Three shapes
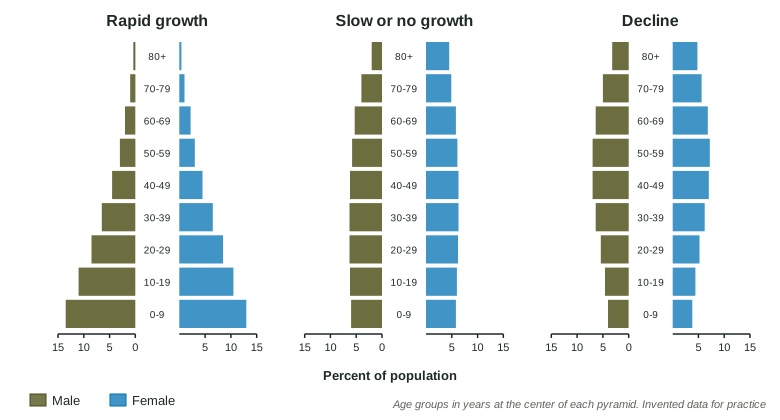
| Shape | What it shows | What happens next | Typical of |
|---|---|---|---|
| Pyramid, wide base | many children and young adults | rapid growth | developing countries |
| Column | about equal numbers in each cohort up to old age | slow or no growth | developed countries |
| Narrow base | fewer young than middle-aged people | decline | some developed countries |
Two pyramids can have the same total population and very different futures. That is why the exam asks about shape, not just size. The key part of the diagram is the base, together with the cohorts just above it: these are the parents of the next generation. Compare the base with the middle to predict the trend.
Worked example. Country X has 30.1 million people, and 14.9 million of them are under 20. What percent is under 20?
Setup: . Answer: .
Almost half the population is under 20, a very wide base. Country X's population will grow rapidly, and it will need schools now and jobs and homes for these young people soon.
Population momentum
A country with a wide base keeps growing for decades even if families suddenly become smaller. The reason is the size of the young cohorts: they still have to grow up, and when they reach parenting age there are so many of them that births stay high, even at two children per family. This delay is population momentum. It works in reverse too: a country with a narrow base can keep shrinking for decades even if families get larger, because there are so few young parents.
Other features of a pyramid
- A bulge in one cohort, such as a baby boom, moves up the pyramid as that cohort ages.
- Longer female bars at old ages show that women tend to live longer than men.
- A dent can mark a war, a famine or an epidemic that killed many people, or a time when few children were born.
On the exam
- Name the shape and predict growth, stability or decline, using the base compared with the middle.
- Quote numbers from the bars when you compare countries or age groups.
- Explain population momentum as a chain: large young cohorts, more people of parenting age, more births, continued growth.