Why do some countries grow fast while others have stopped growing? One model ties it together: the demographic transition. It follows how crude birth and death rates change as a country develops economically, and it links those changes to the age structure diagrams and fertility rates of earlier topics.
The four stages
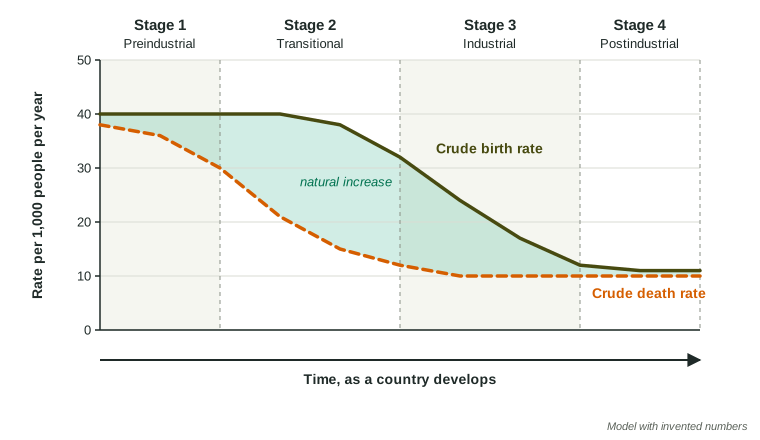
| Stage | Birth rate | Death rate | Growth | Typical pyramid |
|---|---|---|---|---|
| 1 Preindustrial | high | high | slow | wide base, few older people |
| 2 Transitional | high | falling fast | fastest | very wide base |
| 3 Industrial | falling | low | slowing | base starting to narrow |
| 4 Postindustrial | low | low | little, none or negative | column or narrow base |
Why the death rate falls first
In stage 1, without clean water, vaccines or a steady food supply, many people die young, especially children, and families have many births. As a country gains clean water, sewers, vaccines, antibiotics and steadier harvests, deaths fall quickly. These changes save lives right away. Family size changes more slowly, because it depends on customs, schooling, jobs and whether parents trust that their children will survive. So births stay high for a time, and the population booms: stage 2.
Worked example. In 1910 a country's crude birth rate was 37 and its crude death rate was 20. What were its rate of natural increase and its doubling time?
Natural increase: a year.
Doubling time: years.
In 1870, with rates of 38 and 34, natural increase was only . The fall in the death rate more than quadrupled the growth rate.
Why the birth rate falls later
In stage 3, people move to cities, where children cost more to raise and do not work on farms. Girls stay in school longer and women take paid jobs. Infant mortality is now low, so parents no longer need many births for some children to survive. Family planning becomes easier to get. The total fertility rate drops, and the birth rate follows it down toward the death rate.
In stage 4, both rates are low and close together. Some countries have gone further: their birth rate has fallen below their death rate, and their populations are shrinking unless people move in.
Limits of the model
The model was built from the history of European countries, where rates fell over a century or more as incomes rose. Many countries today moved through stage 2 much faster, because medicine and vaccines arrived quickly. Some have lowered their death rates without large gains in income, and their birth rates remain high. The model describes a common pattern, not a schedule every country must follow.
On the exam
- Identify a stage from birth and death rates, and say why (high and high, falling deaths, falling births, low and low).
- Explain the order: the death rate falls first, then the birth rate, and growth is fastest when the gap is widest.
- Match each stage with its typical age structure diagram.