If you followed a group of newborns of one species and counted how many were still alive each year, you would get a curve that tells you when that species tends to die. A survivorship curve is that graph. Three basic shapes, Types I, II and III, cover most species.
Reading a survivorship curve
The x-axis is age, often shown as a percent of the maximum life span so species with very different lives can be compared. The y-axis is the number still alive, usually starting at 1,000 and drawn on a log scale. On a log scale each step up the axis is ten times the one below (1, 10, 100, 1,000), so the graph can show 1,000 survivors and 2 survivors clearly on the same axis.
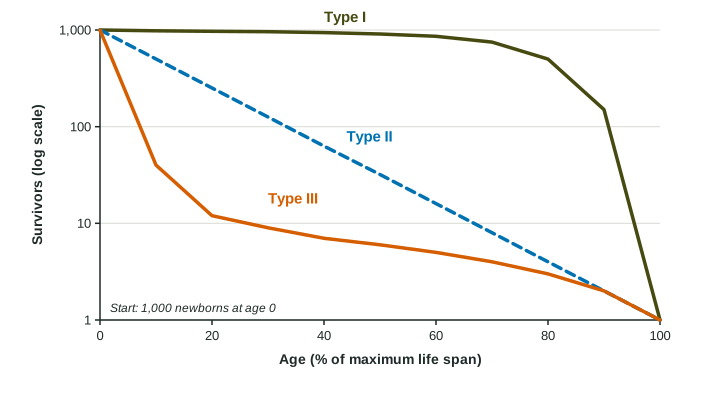
The three types
| Type | When most deaths happen | Shape | Examples |
|---|---|---|---|
| Type I | late in life | stays high, then drops steeply | humans in wealthy countries, elephants, many large mammals |
| Type II | at a steady rate at every age | a straight line on a log scale | many songbirds, lizards, some rodents |
| Type III | very early in life | drops steeply, then levels off | oysters, most fish, many insects and plants |
Why is Type II a straight line on a log scale? Because the same fraction dies in each age interval. If half the survivors die each year, the counts go 1,000, 500, 250, 125. Each step down is the same size on a log scale, so the line is straight.
Worked example. Of 1,000 young of a fish species, 50 are alive at age 1. What percent died in the first year?
Setup: . Answer: .
Losing 95% in the first year and then surviving well is the Type III pattern. For a second species with 1,000, 500, 250, 125 survivors in its first years, half are lost each year: Type II.
What shapes the curve
Species that protect and feed their young, and are large enough to escape most predators as adults, keep their young alive, so deaths are pushed toward old age (Type I). Species that release huge numbers of tiny, unprotected eggs or seeds lose most of them almost at once to predators, weather and starvation (Type III). A species facing about the same risk at every age, such as a small bird that can be caught by a hawk whether young or old, follows Type II.
The curve for one species can change. Better medical care for babies and children has made the human curve in many countries more strongly Type I over the last century.
Survivorship is not the same as r- and K-selection
This is a classic exam trap. A survivorship curve describes when deaths happen. r- and K-selection describe how a species reproduces. The two are related: K-selected species, which care for few offspring, usually have Type I or Type II curves, and r-selected species, which leave many offspring unprotected, usually have Type II or Type III curves. But they are different ideas, and an answer that treats "Type III" and "r-selected" as the same thing loses the point.
On the exam
- Identify a type from a graph or table: a late drop (I), a steady fall (II), or an early drop (III).
- Explain the shape from the species' biology: care for young, number of offspring, risk at each age.
- Keep survivorship and reproductive strategy separate, and say how they are linked when asked.