A graph lets you see a limit. A table lets you test one. When you can evaluate a function but cannot see its graph, or when all you have is a set of measurements, you choose inputs closer and closer to the point and watch the outputs. This page shows how to build that table, how to read it, and how a table can fool you if you stop too soon.
Closing in from both sides
To estimate , pick inputs that approach from the left and from the right, getting closer each time. A standard choice is to shrink the distance by a factor of 10:
and
Skip itself. The limit never uses it, and often the formula is undefined there anyway. Then read each side the way you read each side of a graph: the outputs for inputs below estimate the left-hand limit, and those above estimate the right-hand limit.
Worked example 1. Estimate .
At the formula has a zero denominator, so make a table:
| 1.9 | 1.99 | 1.999 | 2.001 | 2.01 | 2.1 | |
| 0.251582 | 0.250156 | 0.250016 | 0.249984 | 0.249844 | 0.248457 |
From the left, the values fall toward 0.25. From the right, they rise toward 0.25. Both sides agree, so the table suggests
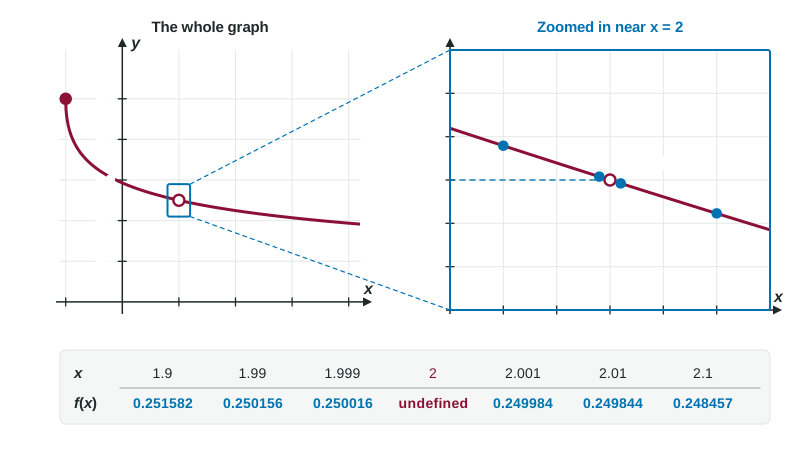
The estimate is the number the values approach. The table value closest to , 0.250016, is only an approximation; the limit is 0.25. On the exam, a question that says "estimate the limit" from a table expects that settled number.
When a table says "no limit"
The same three behaviors that stop a limit on a graph show up in tables:
| The table shows | Conclusion |
|---|---|
| Left side settles on one number, right side on another | one-sided limits differ: no limit |
| Outputs like 100, 10,000, 1,000,000 as gets closer | unbounded: no limit |
| Outputs that keep jumping around, never settling | oscillating: no limit |
Worked example 2. A shipping company charges dollars for a package of weight pounds. Its table gives 5.25 for = 1.9, 1.99, 1.999 and 2, and 7.40 for = 2.001, 2.01, 2.1. Find the one-sided limits at 2 and decide whether exists.
Since , does not exist. In context: the price jumps for packages just over 2 pounds.
A table suggests; it does not prove
A table checks finitely many inputs, and a function can do something surprising between them or closer in. Here is a function built to fool a short table:
| 1.1 | 1.01 | 1.001 | 1.0001 | 1.00001 | |
| 2.0001 | 2.0099 | 2.5 | 2.9901 | 2.9999 |
Stop after two columns and you would say the limit is 2. Keep going and the values head to 3. The lesson is not that tables are useless. It is that you keep going until the values clearly settle, and when the stakes are high, you confirm with algebra or a graph.
A second caution: a calculator rounds. For inputs extremely close to , such as , subtracting two nearly equal numbers can wipe out the digits that matter, and the calculator may show nonsense like 0. Inputs within 0.001 or 0.0001 of are usually plenty.
Tables in context
Exam tables often come from measurements: temperatures, costs, flow rates. When you state a limit in context, include the units and the direction. "As the weight approaches 2 pounds from above, the shipping cost approaches $7.40" is a complete answer. And as always, a value in the table at itself, such as , tells you and nothing about the limit.