Most limit questions with a graph point at the interesting places: a hole, a jump, a filled dot sitting off the curve, a vertical asymptote. At those places the two sides of the graph can tell different stories. The skill on this page is simple to state: look at each side separately, then decide. It turns every graph question into two easy readings.
Approaching from one side
Put your finger on the graph to the left of and slide it toward , staying on the left. The height your finger heads to is the left-hand limit: The small minus sign means "from below," that is, using only . Do the same from the right and you get the right-hand limit, , using only . Each is a one-sided limit.
Notice the sign is a direction, not a number. means takes values like 1.9, 1.99, 1.999, all below 2.
When the limit exists
The ordinary, two-sided limit asks for both sides at once. The rule that connects them is the most used fact in this unit:
exactly when and .
If the two sides head to the same height, that height is the limit. If they head to different heights, there is no limit.
Worked example 1. A graph of has a line rising to an open circle at from the left, a curve leaving that same open circle to the right, and a filled dot at . At , a curve arrives at a filled point from the left, and a new line starts at an open circle to the right. Find the limits.
At : from the left, the heights head to 3. From the right, also 3. So . The dot says ; that is the value, not the limit.
At :
Three ways a limit can fail to exist
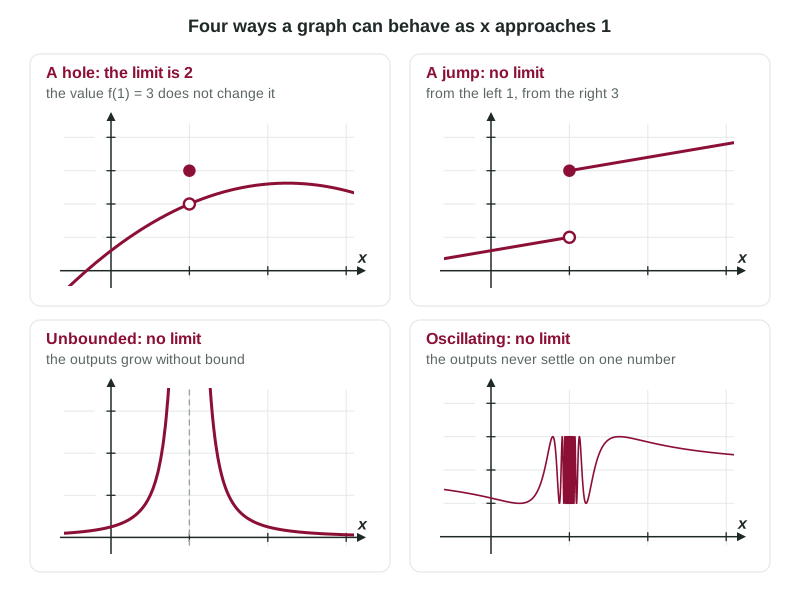
When the limit does not exist (sometimes written DNE), the reason is always one of these:
| Behavior near | What the graph does | Why there is no limit |
|---|---|---|
| Jump | the two sides head to different heights | one-sided limits are unequal |
| Unbounded | the graph shoots up or down along a vertical asymptote | the outputs grow without bound, so they approach no number |
| Oscillating | the graph wiggles faster and faster | the outputs never settle near one number |
Unbounded behavior can happen on one side or both. If the graph rises without bound on both sides of , the outputs still approach no number, so the limit does not exist. Topic 1.14 adds a special notation for this case; for now, describe it in words: " increases without bound as ."
Dots never decide a limit
A filled dot answers one question only: what is ? An open circle answers: what point is missing? Neither one tells you the limit, which depends only on the heights near . Students lose points by reading the dot as the limit, or by concluding that a limit cannot exist where is undefined. A hole is the clearest counterexample: the limit is the hole's height, and there is no value at all.
Scale can hide behavior
A graph is a picture, and pictures have limits of their own. A calculator draws with pixels, so a single missing point, such as the hole in at , is invisible at a normal zoom. A tiny wiggle or a narrow spike can also hide between pixels. A graph suggests a limit; the formula, a table of values or algebra confirms it. If the scale looks suspicious, zoom in or check with the formula.
Writing a graph-based answer
When you justify a conclusion about a limit, name both sides with their values. Compare:
| Loses the point | Earns the point |
|---|---|
| "The graph jumps, so no limit." | " |
| ", so the limit is 1." | " and , so ." |
Worked example 2. A function has , and . Describe the graph near and give .
Both sides head to height 7, so .
The graph has an open circle at and a filled dot below it at .