So far each limit came in one form: a graph, a table, or a formula. The exam mixes them. A question may give a graph of and a formula for , or a table and ask for a formula that fits. This page shows how to read a limit from each representation, what each one can and cannot tell you, and how to move between them.
One function, four views
The same function can be described four ways.
| Representation | How you read the limit | Watch out for |
|---|---|---|
| Graph | follow the curve to from each side; read the height it approaches | a closed dot at is the value, not the limit; the scale can hide a hole or a jump |
| Table | look at values for inputs closing in on from both sides | a table estimates; it cannot prove |
| Formula | substitute; rewrite if you get | algebra slips; break points of piecewise formulas |
| Words | translate into notation | which side, and which number is the input |
Reading a graph
Put your finger on the curve to the left of and slide toward . Note the height you are heading to. Do the same from the right. If the two heights match, that height is the limit. Then, separately, look at what is plotted exactly at : a closed dot gives , and it may sit somewhere else entirely, or be missing.
A graph on a calculator screen can hide things. A single missing point is too small to see, and a zoomed-out window can make a fast change look like a jump. When a graph and a formula seem to disagree, trust the formula and zoom in.
Reading a table
A good table uses inputs on both sides of that get closer and closer to it: and for . Read the trend on each side. If both sides settle toward one number, that is your estimate.
An estimate is not a proof. Here is a trap. At , the function equals 0 every time, because is a multiple of . But at it equals 1, and inputs like that sit as close to 0 as you like. The function keeps swinging between and and has no limit at 0. The table was simply unlucky.
From a table to a formula and back
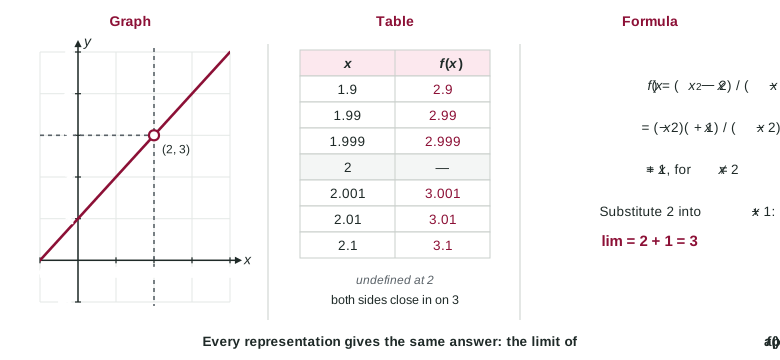
Worked example 1. A table gives values of : and . Estimate , then confirm it.
Estimate: from both sides the values approach 3.
Confirm with algebra. Substituting gives , so factor both parts:
Substitute: . The table and the formula agree.
Going the other way, a formula tells you what its graph looks like. The expression equals except at , where it is undefined. Its graph is the line with a hole at .
Words and notation
Translate carefully. "As approaches 4 from values less than 4, approaches 7" is . The side goes with the input, as a small minus or plus sign on the 4. The number after the equals sign is the output the values approach. A sentence about is a sentence about the value, not the limit.
Limits of compositions
Exam questions love with given by a graph and by a formula or a table. Work from the inside out, and keep track of the side.
Worked example 2. A graph of shows and . Let . Find .
Inside: as , . Which side? is greater than 1 for every , so approaches 1 from above.
Outside: inputs approaching 1 from above give values approaching 5.
So
When the function inside approaches its limit from both sides, you need the outer limit from both sides, and the two must agree.