Limits Across Graphs, Tables and Formulas
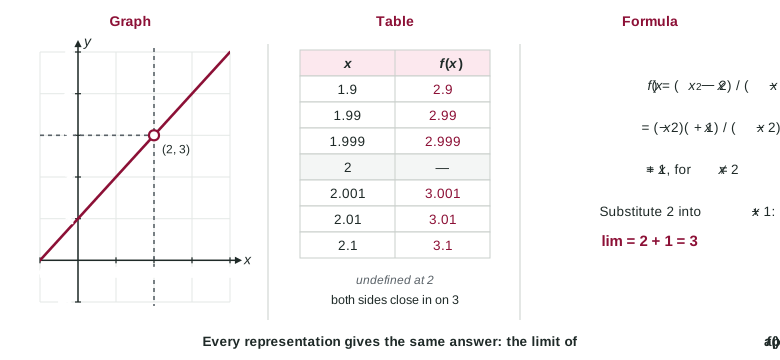
A limit can be read from a graph (the height the curve approaches), estimated from a table (values on both sides), found exactly from a formula (algebra), and stated in words or notation.
Part 1 · Hook
Why this matters
Part 2 · Before you start
What this builds on
Part 3 · Prerequisite check
Quick check before you start
1. On a graph, an open circle at means
- the point is not on the graph
- the function equals 3 at
- the graph has a vertical asymptote at
- the limit at 2 does not exist
Show the answer
An open circle marks a missing point; a closed dot marks a point that is there.
- Correct: the point is not on the graph:
- the function equals 3 at :
- the graph has a vertical asymptote at :
- the limit at 2 does not exist:
2. To estimate from a table, you should use inputs
- on both sides of 2, closer and closer to it
- equal to 2
- far from 2, so the pattern is clear
- greater than 2 only
Show the answer
A two-sided limit needs values from both sides, approaching 2.
- Correct: on both sides of 2, closer and closer to it:
- equal to 2:
- far from 2, so the pattern is clear:
- greater than 2 only:
3. equals which expression for ?
Show the answer
, and the cancels.
- Correct: :
- :
- :
- :
Part 4 · See it
See it first
Part 5 · Step by step
How it works, step by step
- A graph shows the function near follow the curve toward from each side and read the height it approaches; ignore any dot exactly at
- A table lists values at inputs closing in on from both sidesthe values suggest the limit, but a table cannot prove it
- A formula is availablealgebra (substitute, factor, rationalize) gives the exact limit and confirms the estimate
- A limit involves a composition find where goes and from which side, then read near that input
Part 6 · Key ideas
Key ideas
- The same limit can be read from a graph, a table, a formula or words. Each answer must agree.
- On a graph, the limit is the height the curve approaches, not the closed dot at the point.
- A table suggests a limit; a formula confirms it. Cleverly chosen inputs can make a table mislead, as with .
- Translate words exactly: "from values less than 4" is ; the number the outputs approach goes after the equals sign.
- For , find the inner limit first and note the side it comes from.
Part 7 · Misconception
A common mistake
The wrong idea: If every value in a table is close to 3, the limit is 3.
What actually happens: A table shows finitely many inputs. The function can behave differently between them; is 0 at but has no limit at 0. Use the table to estimate and a formula or a graph to confirm.
Part 8 · Check yourself
Check yourself
Exam-style questions. Anything you miss goes into your review queue.
Graph
The graph of
1. Use the graph to find .
No calculator. Type the exact value (a fraction, π, e or a root is fine).
Show the answer
From the left, approaches 2; from the right, approaches 2. Both sides agree, so the limit is 2, even though .
- Answer: 2
2. Which is true about ?
- It does not exist; the sides head to and
- It equals , the height of the closed dot at
- It equals , the height of the open circle at
- It equals , halfway between the two one-sided limits
Show the answer
and . The one-sided limits differ, so the two-sided limit does not exist.
- Correct: It does not exist; the sides head to and : Left of 2 the graph follows down to ; right of 2 it starts at 1. Different, so no limit.
- It equals , the height of the closed dot at : The closed dot is and the right-hand limit, but the left side does not head there.
- It equals , the height of the open circle at : That is the left-hand limit; the right side heads to 1.
- It equals , halfway between the two one-sided limits: One-sided limits are compared, never averaged.
3. Find .
No calculator. Type the exact value (a fraction, π, e or a root is fine).
Show the answer
Inside: near , , which approaches 1. Outside: for inputs near 1 (on both sides), , which approaches 0. So
- Answer: 0
Table
Values of near
| 1.9 | 1.99 | 1.999 | 2.001 | 2.01 | 2.1 | |
|---|---|---|---|---|---|---|
| 2.92564 | 2.99251 | 2.99925 | 3.00075 | 3.00751 | 3.07561 |
4. Which formula could produce the table?
Show the answer
- : This simplifies to , which is 3.9 at and approaches 4.
: This simplifies to , which approaches 6. - Correct: : It simplifies to , which gives 2.92564 at 1.9 and approaches 3.
- : It approaches 3, but gives exactly 2.9 at , not 2.92564.
5. A table gives at and . What is true about ?
- It equals 0, since each value in the table is 0
- It does not exist; the values swing between and
- It equals 1, the largest value the sine function reaches
- It equals 0, but from the right side of 0 alone
Show the answer
The chosen inputs make a multiple of , where sine is 0. Other inputs, such as , give . Near 0 the function hits and again and again, so it has no limit.
- It equals 0, since each value in the table is 0: The table's inputs were unlucky: they all land on zeros of sine. A table can mislead.
- Correct: It does not exist; the values swing between and : Inputs like give 1, and others give , arbitrarily close to 0.
- It equals 1, the largest value the sine function reaches: The function reaches 1 near 0 but does not settle there.
- It equals 0, but from the right side of 0 alone: The table is from the right side already, and the values there oscillate.
6. Let . Suppose and . What is ?
- It does not exist
Show the answer
As , , and for every . So the inputs of approach 1 from the right, and .
- : That would need to approach 1 from below, but .
- : Limits are not averaged.
- Correct: : is above 1 on both sides of , so only the right-hand limit of matters.
- It does not exist: Both sides of send to 1 from above, so the limit exists and is 5.
7. A function has and . What does its graph show at ?
- A closed dot at and an open circle at
- A closed dot at and a vertical asymptote
- Two closed dots, one at and one at
- An open circle at and a closed dot at
Show the answer
The curve heads to height 4 from both sides but the point there is missing (open circle). The function's value, 1, sits elsewhere as a closed dot.
- A closed dot at and an open circle at : That would make , and the curve would head toward 1.
- A closed dot at and a vertical asymptote: An asymptote means unbounded behavior, but the limit is the number 4.
- Two closed dots, one at and one at : A function has one value at , so there is one closed dot.
- Correct: An open circle at and a closed dot at : The curve approaches , which is not on the graph, and the actual point is .
Part 9 · Summary
Summary
Part 10 · Up next
What comes next
Part 11 · Connections