Estimating Limits from Tables
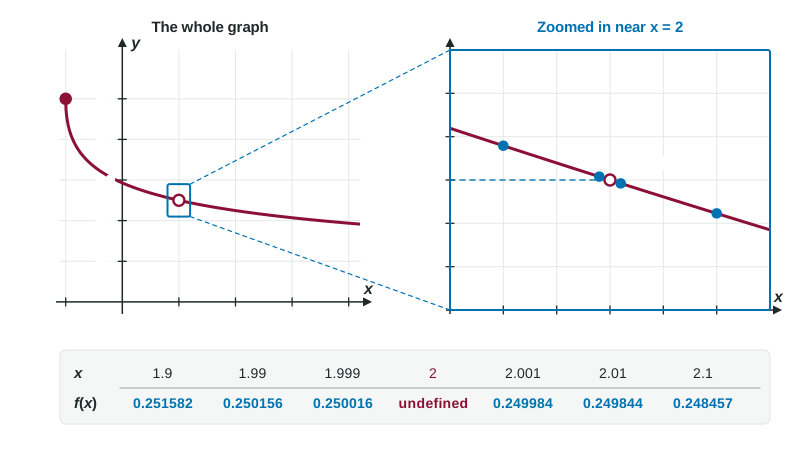
A table estimates a limit when it lists outputs for inputs closing in on a from both sides.
Part 1 · Hook
Why this matters
Part 2 · Before you start
What this builds on
Part 3 · Prerequisite check
Quick check before you start
1. When does exist?
- When both one-sided limits exist and are equal
- When is defined
- When the graph has no holes
- When the left-hand limit exists
Show the answer
Both sides must exist and agree.
- Correct: When both one-sided limits exist and are equal:
- When is defined:
- When the graph has no holes:
- When the left-hand limit exists:
2. Which inputs approach 4 from the left?
- 3.9, 3.99, 3.999
- 4.1, 4.01, 4.001
- 4, 4, 4
- 0, 1, 2
Show the answer
From the left means below 4, getting closer.
- Correct: 3.9, 3.99, 3.999:
- 4.1, 4.01, 4.001:
- 4, 4, 4:
- 0, 1, 2:
Part 4 · See it
See it first
Part 5 · Step by step
How it works, step by step
- Choose inputs closer and closer to from the left, and from the right (never itself)the outputs show each one-sided trend
- Both sides settle on the same numberthat number is a numerical estimate of the limit
- The sides settle on different numbers, grow without bound, or keep jumping aroundthe table suggests the limit does not exist
- A table checks only finitely many inputsit suggests a limit but cannot prove it; confirm with a graph or algebra
Part 6 · Key ideas
Key ideas
- To estimate , evaluate at inputs like and .
- Read each side separately, exactly as on a graph: the left-hand limit uses inputs below , the right-hand limit inputs above .
- The estimate is the number the outputs approach, not the last value in the table. A value in the table never decides the limit.
- A table can mislead if it stops too early. If the values have not settled, test inputs even closer to .
Part 7 · Misconception
A common mistake
The wrong idea: The limit is the table value at the input closest to .
What actually happens: The limit is the number the values approach. The closest value, such as 27.009001, is only an approximation of the limit, 27.
Part 8 · Check yourself
Check yourself
Exam-style questions. Anything you miss goes into your review queue.
Table
Values of near
| 2.9 | 2.99 | 2.999 | 3.001 | 3.01 | 3.1 | |
|---|---|---|---|---|---|---|
| 26.11 | 26.9101 | 26.991001 | 27.009001 | 27.0901 | 27.91 |
1. Use the table to estimate .
No calculator. Type the exact value (a fraction, π, e or a root is fine).
Show the answer
From the left, 26.11, 26.9101, 26.991001 rise toward 27. From the right, 27.91, 27.0901, 27.009001 fall toward 27. Both sides suggest .
- Answer: 27
2. Which table values are evidence for the estimate of ?
- 26.11, 26.9101 and 26.991001
- 27.91, 27.0901 and 27.009001
- 26.991001 and 27.009001, the two closest values
- The value of
Show the answer
A left-hand limit uses only : the inputs 2.9, 2.99 and 2.999, whose outputs are 26.11, 26.9101 and 26.991001.
- Correct: 26.11, 26.9101 and 26.991001: Inputs below 3.
- 27.91, 27.0901 and 27.009001: Those come from : evidence for the right-hand limit.
- 26.991001 and 27.009001, the two closest values: One value from each side cannot show a left-hand trend.
- The value of : is not defined, and a limit never uses it.
3. What does the table tell you about ?
- Nothing; it shows only the trend near 3.
- , because the values close in on 27.
- is about 27.009, the closest value in the table.
- , because 3 is not in the table.
Show the answer
A table near shows a trend, which estimates the limit. It does not give the value at 3; the caption says is not defined there.
- Correct: Nothing; it shows only the trend near 3.: Trend near 3 versus value at 3.
- , because the values close in on 27.: A limit and a value can differ; here the value does not exist.
- is about 27.009, the closest value in the table.: is a value at 3.001, not at 3.
- , because 3 is not in the table.: A missing table entry is not a zero.
4. Which additional input would best strengthen the estimate of ?
- 3.0001
- 3.5
- 2.9999
- 4
Show the answer
A right-hand limit needs inputs above 3, closer than any already in the table. 3.0001 is the closest such input.
- Correct: 3.0001: Above 3, and closer than 3.001.
- 3.5: 3.5 is farther from 3 than the table's values; it adds little.
- 2.9999: 2.9999 is below 3: it helps the left-hand limit, not the right-hand one.
- 4: 4 is far from 3.
Table
Shipping cost by weight
| (pounds) | 1.9 | 1.99 | 1.999 | 2 | 2.001 | 2.01 | 2.1 |
|---|---|---|---|---|---|---|---|
| (dollars) | 5.25 | 5.25 | 5.25 | 5.25 | 7.40 | 7.40 | 7.40 |
5. What does the table suggest about ?
- It does not exist: 5.25 from the left, 7.40 from the right.
- It is 5.25, because the table gives exactly.
- It is 6.325, the average of the left and right values.
- It is 7.40, because the cost goes up once a package passes 2 pounds.
Show the answer
The two one-sided limits differ, 5.25 versus 7.40, so the two-sided limit does not exist. The cost jumps at 2 pounds.
- Correct: It does not exist: 5.25 from the left, 7.40 from the right.: Unequal one-sided limits.
- It is 5.25, because the table gives exactly.: is a value; the right side still heads to 7.40.
- It is 6.325, the average of the left and right values.: A limit is never an average of two different sides.
- It is 7.40, because the cost goes up once a package passes 2 pounds.: That is only the right-hand limit.
6. For the values of are 100, 10,000 and 1,000,000. For they are also 100, 10,000 and 1,000,000. What does the table suggest about ?
- It does not exist: the values grow without bound from both sides.
- 1,000,000, the largest value in the table
- 1, the input being approached
- It exists, because both sides show exactly the same values at matching distances.
Show the answer
Each step closer to 1 multiplies the output by 100. The outputs are unbounded, so they approach no number and the limit does not exist.
- Correct: It does not exist: the values grow without bound from both sides.: Unbounded outputs approach no number.
- 1,000,000, the largest value in the table: The values keep growing past any number, including 1,000,000.
- 1, the input being approached: 1 is the input, not a value the outputs approach.
- It exists, because both sides show exactly the same values at matching distances.: Matching sides only help when they close in on a number; these grow without bound.
7. For and , a function gives 2.0001, 2.0099 and 2.5. A student says, "The first two values show the limit as is 2." Which response is best?
- The values have not settled; the third moved away from 2, so test closer inputs.
- The student is right: two values that agree are enough evidence to decide a limit like this one.
- The limit is 2.5, because that is the value at the input closest to 1.
- The limit is 2.17, the average of the three values in the table.
Show the answer
A table only suggests a limit, and it can mislead if you stop too early. Here the values jump from about 2.01 to 2.5 at the closest input, so the trend has not settled. Try 1.0001, 1.00001 and so on.
- Correct: The values have not settled; the third moved away from 2, so test closer inputs.: A trend must hold as the inputs get closer, not just at the start.
- The student is right: two values that agree are enough evidence to decide a limit like this one.: The values closest to 1 matter most, and they have not settled yet.
- The limit is 2.5, because that is the value at the input closest to 1.: One value is not a trend either; check closer inputs.
- The limit is 2.17, the average of the three values in the table.: Averaging table values does not give a limit.
Part 9 · Summary
Summary
Part 10 · Up next
What comes next
Part 11 · Connections