Walk along the graph of a function from left to right. Sometimes you climb, sometimes you descend. The derivative is the slope under your feet, so its sign tells you which. This page turns that picture into a method you can use with a formula, a graph of or a table, and into a justification that earns credit.
What increasing means
A function is increasing on an interval if, whenever in the interval, : larger inputs give larger outputs. It is decreasing on an interval if whenever .
The derivative connects to this through the tangent lines. If every tangent line on an interval slopes upward, the graph can only go up there.
- If for every in an interval, then is increasing on that interval.
- If for every in an interval, then is decreasing on that interval.
(The Mean Value Theorem is the reason: between any two points, the average rate equals some , which has the sign of .)
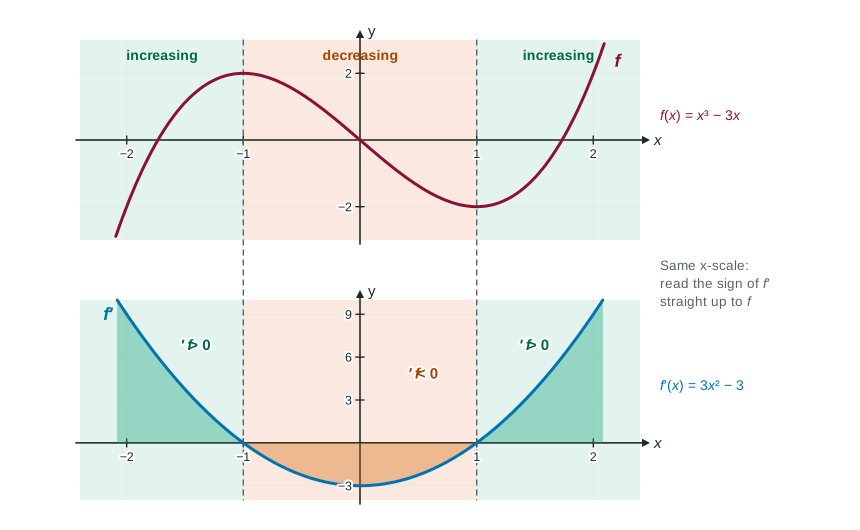
The method with a formula
The sign of can change only where is zero or does not exist (for the functions in this course, does not jump around otherwise). So:
- Find and factor it if you can.
- Find the critical points: where or does not exist. Also note points outside the domain.
- These points cut the number line into intervals. Pick one test value in each interval and find the sign of there.
- increases where and decreases where .
Worked example 1. Where is increasing and where is it decreasing?
| Interval | Test value | Sign of | is |
|---|---|---|---|
| positive | increasing | ||
| negative | decreasing | ||
| positive | increasing |
So increases on and and decreases on .
Worked example 2. Where is increasing?
Product rule:
The factor is always positive, so the sign of is the sign of : positive for . is increasing on .
Factoring out a positive factor like or a square like is the fastest way to read signs. A squared factor never changes sign, so it never flips the direction of .
Reading a graph of
The exam often gives the graph of , not . Then the question "where is increasing?" becomes "where is this graph above the -axis?"
- Graph of above the axis: increasing.
- Graph of below the axis: decreasing.
Do not read the direction of the graph of (rising or falling) for this question. A graph of that is falling but still above the axis means is still increasing, just more slowly. Whether rises or falls is about concavity, a later topic.
The same reading lets you compare values of : if on , then , because went down the whole way.
Tables of values
A table gives at a few points only. A negative value at tells you is decreasing at . It does not tell you what happens between readings: two negative readings do not prove stays negative between them. But if is continuous and changes from positive to negative between two readings, the Intermediate Value Theorem gives a time when .
Writing the justification
A justification names the function and the condition on the interval:
" for , so is increasing on that interval."
Answers that lose the point: "the graph goes up" (which graph?), " is increasing" (wrong condition), or a number line of signs with no sentence. Name , give its sign, give the interval.