Zoom in on the graph of any differentiable function, near any point, and it starts to look like a straight line: its tangent line. This is local linearity. It turns the tangent line into a tool for estimating values that are hard to compute, such as or when you only know at 2. The exam then asks one more question every time: is the estimate too big or too small?
The tangent line as an approximation
The tangent line at passes through with slope . In point-slope form it is the linearization of at :
For close to , . Read the formula as a story: start at the known height , then add the rate times the step . It is the "rate times change" idea from the derivative in context, written as a line.
Worked example 1. Estimate .
Choose a nearby point where is easy: , .
, so .
Worked example 2. A table gives and . Estimate .
, so
The step is negative because 4.8 is to the left of 5. Dropping that sign is a common slip.
Too big or too small? Concavity decides
A graph is concave up where it bends upward, like a cup, and concave down where it bends downward, like a cap. The second derivative tells which: means is increasing, so the slopes keep growing and the graph bends up; means the graph bends down. (Unit 5 studies concavity in full; here we need just this much.)
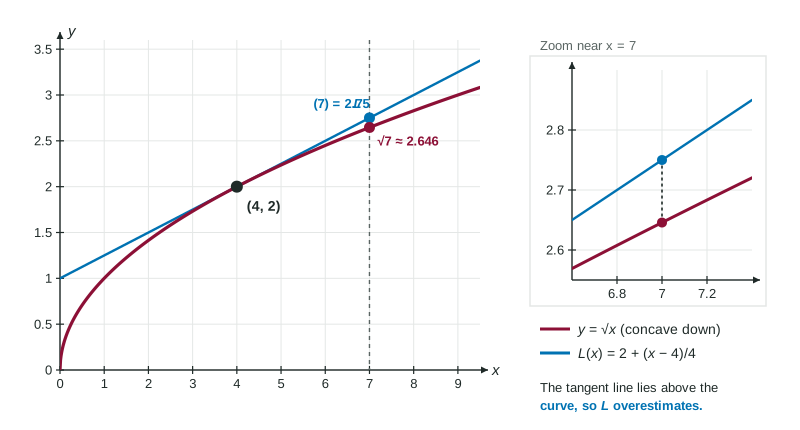
A concave up graph lies above its tangent lines, so the line gives values that are too small: an underestimate. A concave down graph lies below its tangent lines, so the line gives an overestimate.
| On the interval between and | Shape | Tangent line is | is |
|---|---|---|---|
| concave up | below the graph | an underestimate | |
| concave down | above the graph | an overestimate |
Worked example 3. Use the tangent line to at to estimate , and decide whether the estimate is too large or too small.
and the slope is , so and .
The second derivative of is , which is negative for every . The graph is concave down, so the tangent line lies above it, and is an overestimate. (Indeed .)
The justification must name concavity. "Overestimate because is increasing" does not earn the point: whether is increasing decides which way the line tilts, not which side of the curve it sits on. The concavity must hold on the whole interval between and the point you estimate.
How good is the estimate?
The gap between the curve and the line is tiny near and grows as you move away. Using the tangent line at , is estimated as (true value about ), but is estimated as (true value about ). Always build the line at the known point closest to where you estimate.
Slips that cost points
- Swapping the height and the slope in
. - Losing the sign of when estimating to the left of .
- Justifying over or under with the sign of , or with no reason.
- Using a tangent line built at a point far from the estimate.