Local Linearity and Linearization
Near x = a , f(x) ≈ L(x) = f(a) + f′(a)(x − a) .
Part 1 · Hook
Why this matters
Part 2 · Before you start
What this builds on
Part 3 · Prerequisite check
Quick check before you start
1. The line tangent to at is
Show the answer
Point , slope .
- Correct: :
- :
- :
- :
2. If , then is
Show the answer
, then .
- Correct: :
- :
- :
- :
Part 4 · See it
See it first
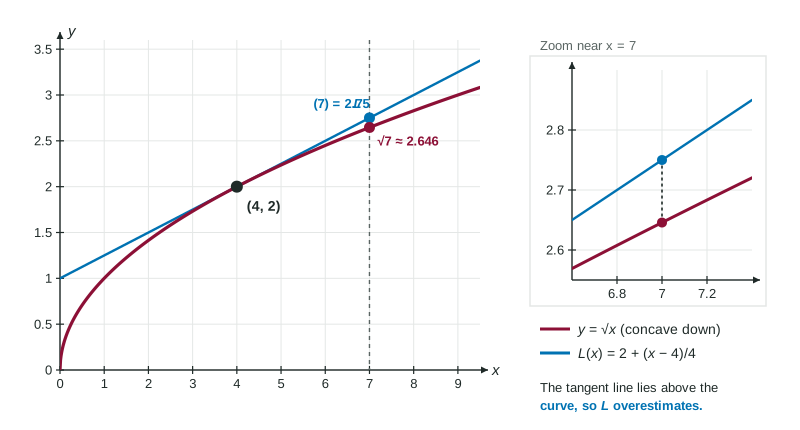
Part 5 · Step by step
How it works, step by step
- Near , a differentiable graph is nearly straightit is close to its tangent line
- So for near
, the tangent line approximation - If between and , the graph is concave up and lies above the linethe approximation is an underestimate
- If there, the graph is concave down and lies below the linethe approximation is an overestimate
Part 6 · Key ideas
Key ideas
- The linearization at :
. Use the point closest to where you estimate. - Concave up (): tangent line below the graph, underestimate. Concave down (): overestimate.
- Justify with the concavity on the interval between and , not with the sign of .
- The closer is to , the better the approximation.
Part 7 · Misconception
A common mistake
The wrong idea: The tangent line approximation overestimates because is increasing.
What actually happens: Whether increases decides which way the line slopes, not which side of the graph it is on. Concavity decides: concave down means overestimate, concave up means underestimate.
Part 8 · Check yourself
Check yourself
Exam-style questions. Anything you miss goes into your review queue.
Table
Values of , and
1. Using the table, write the linearization of at , in the form
Type an expression for .
Show the answer
The point is and the slope is : .
- Answer:
2. Use the tangent line at to approximate .
No calculator. Type the exact value (a fraction, π, e or a root is fine).
Show the answer
- Answer: ≈ 4.700
3. Is the approximation of from the tangent line an overestimate or an underestimate?
- An underestimate, because makes concave up there
- An overestimate, because
- An overestimate, because there
- Neither: the tangent line gives the exact value of
Show the answer
On , , so the graph is concave up and lies above the tangent line. is below : an underestimate.
- Correct: An underestimate, because makes concave up there: A concave up graph lies above its tangent lines.
- An overestimate, because : The sign of says which way the line slopes, not which side of the graph it lies on.
- An overestimate, because there: Concave up puts the tangent line below the graph, giving an underestimate.
- Neither: the tangent line gives the exact value of : The line matches only at ; elsewhere the graph bends away from it.
4. Use the line tangent to the graph of at to approximate .
No calculator. Type the exact value (a fraction, π, e or a root is fine).
Show the answer
, so
- Answer: ≈ 0.600
5. Is the approximation of an overestimate or an underestimate?
- An underestimate, because there
- An overestimate, because makes concave down there
- An underestimate, because 4.8 lies to the left of the point
- An overestimate, because
Show the answer
On , : concave down, so the tangent line lies above the graph and overestimates .
- An underestimate, because there: Concave down puts the tangent line above the graph.
- Correct: An overestimate, because makes concave down there: A concave down graph lies below its tangent lines.
- An underestimate, because 4.8 lies to the left of the point : The side of the point does not matter; the concavity does.
- An overestimate, because : The sign of does not decide; the reason must be about .
6. If the graph of is concave up on an interval containing , the line tangent to the graph at
- lies above the graph near , so it overestimates
- crosses the graph at
- lies below the graph near , so it underestimates
- gives exact values near
Show the answer
Concave up: the graph bends upward, away from the tangent line, so the line lies below it and tangent line approximations are underestimates.
- lies above the graph near , so it overestimates : That happens when the graph is concave down.
- crosses the graph at : With constant concavity, the graph stays on one side of its tangent line near .
- Correct: lies below the graph near , so it underestimates : Concave up graphs bend up away from their tangent lines.
- gives exact values near : It matches exactly only at .
Part 9 · Summary
Summary
Part 10 · Up next
What comes next
Part 11 · Connections